February 24, 2011

Day Trading Morning Prep Gold, Crude Oil, Dollar Index, Euro, E-mini Russell Futures

‘We are what we repeatedly do.  Excellence, therefore, is not an act, but a habit’ – Aristotle
Let’s begin our morning routine with the economic news for today’s trading session.
8:20 Gold & Currencies OPEN
8:30 Durable Goods Orders

9:00 Crude Oil OPEN
9:30 US Market OPEN
10:30 Nat Gas report
11:00 Transition into Lunch
11:30 European Close / Live Webinar in our Trade Room
Looking at the news today, we can see that the Holiday on Monday has delayed many news events from earlier this week into today.
It will be important for us to use the  Dollar Index Futures Correlation to determine the market’s reaction to this news.
I will set my alarm 5 minutes before the news, and then wait 5 minutes after the news to see the market’s reaction.
Lets take a look at the charts we’re watching this morning…
the daily chart of the dollar shows us in the middle of the price wedge, with major support at 76.995.  We will watch closely to see how this level plays out.
If price bounces off this support we can expect to get selling opportunities on the markets we trade most.
If price blows through this support level,creating new lows, prices will rise on other markets, giving us buying opportunities.
Crude Oil Futures
Concerns over limited crude oil supply in the middle east continues to push prices higher this morning, even though the global demand has not increased and there is no real shortage of supply, according to a report from Saudi Arabia this morning.
Speculators will continue to play with these new highs, but technical day traders such as ourselves will be trading carefully right now.  People do the strangest things when emotions take control, and this will be prime time for impulse trading in this market.
Ive always found the easiest way to find some sort of ‘order’ to this type of expanding market is to clear off all my chart drawings and start over.
Even with these new prices we still see the same old wedge pattern off the new 103.35 highs.
Looking at this 34range chart you can see three things to consider:
  • Wedge pattern in yellow trend lines
  • Major support at 100.0 and 98.50
  • Price Channel in pink trend lines
The first thing we see is the major support of 100.0 staring us in the face.  We can assume that trading around this level will be increasing volatile and unpredictable.  It wouldnt be too much to think of sitting on hands around this level if you’re a newer trader.
Next, im looking to use the  Wedge Pattern as our guide this morning.  Trading wedges are pretty simple, we need to Buy the lows, sell the highs, and avoid the middle.
The price channel in pink trend line will also be a factor in our trading decisions.  If price doesnt hold the lows of the price wedge pattern, and we trade sideways around 100.30 this pink  trend line will act as ‘sloppy’ support above 100.0
The most difficult part of this chart today is that our goal ( trade the highs and the lows ) happen to be VERY difficult levels.
The highs of 103.35 are the highest levels to date, and the lows are 100.0 which is a disaster waiting to happen.  The only other option is to play the wedge, inside the range, so we will look to use the wedge.
It would be ideal to buy support at 100.0 if price drops, with the goal if price rising back up into the price wedge and taking profit on the buy around 102.0.  Again, 100.0 is a concern, to trade carefully there.
on the upside, I will indeed look to sell the highs of the price wedge around 102.0, 102.64, however 103.41 (HOD)  will also be a tough level being the all-time on this chart.
the daily chart of gold futures shows targets of 1424.4 and 1432.5 for swing traders today, so we will be taking profit at these levels from our discussion on Wednesday morning.

Looking closer at gold on the 34-range chart we see a little more detail about what the market personality looks like.

We see three things to consider on gold today:
  • Price channel in pink trend lines
  • Major resistance overhead of 1417.5 yellow trend line
  • Sideways range from 1417.5 down to 1413.1 and further down to 1411.5
I will be looking at the buying opportunities today with this bullish price channel, If price breaks new highs I will  Buy a Pullback at support, and if price drops to test the lows im always looking to buy at support.

The sideways range from 1417.5 down to 1411.5 will be a great place to Buy the lows, sell the highs, and avoid the middle.

We will assume gold to trade inside this sideways range until proven otherwise, so this will be our first focus this morning.

Keep an eye on trading at the highs of this range, the yellow trend line around 1417.5 will be assumably very ‘sloppy’ with impulsive trades and emotions taking over for traders at new highs on this market.

Euro Currency Futures

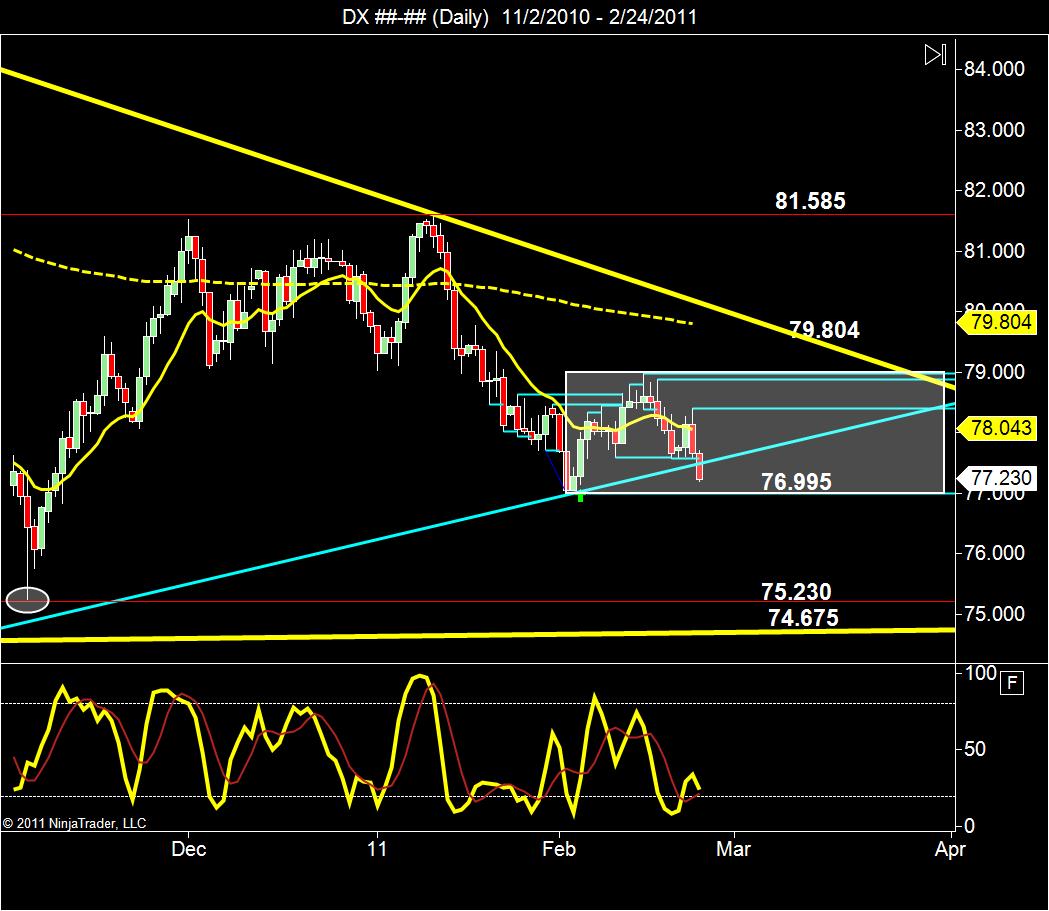
the daily chart on the euro currency futures shows us many important levels of support and resistance to keep an eye on this week.
I would look to sell the highs of the wedge, using the 1.3831 level as our guide, and look to take profit at the lows of the sideways range and using the BMT line around 1.3389. 
  • we first trade the sideways range inside the price wedge
  •  then sell the highs and buy the lows of the price wedge in yellow trend lines.
  • then look to sell the highs of 1.4276 and buy the lows of 1.2891 outside of the wedge.
looking at the 34range chart on the euro we see more detail:
  •  sideways range from 3700 up to 3800
  • major trend lines in yellow create a wide wedge pattern
  • minor trend line in blue creates a very narrow wedge at the highs of the range

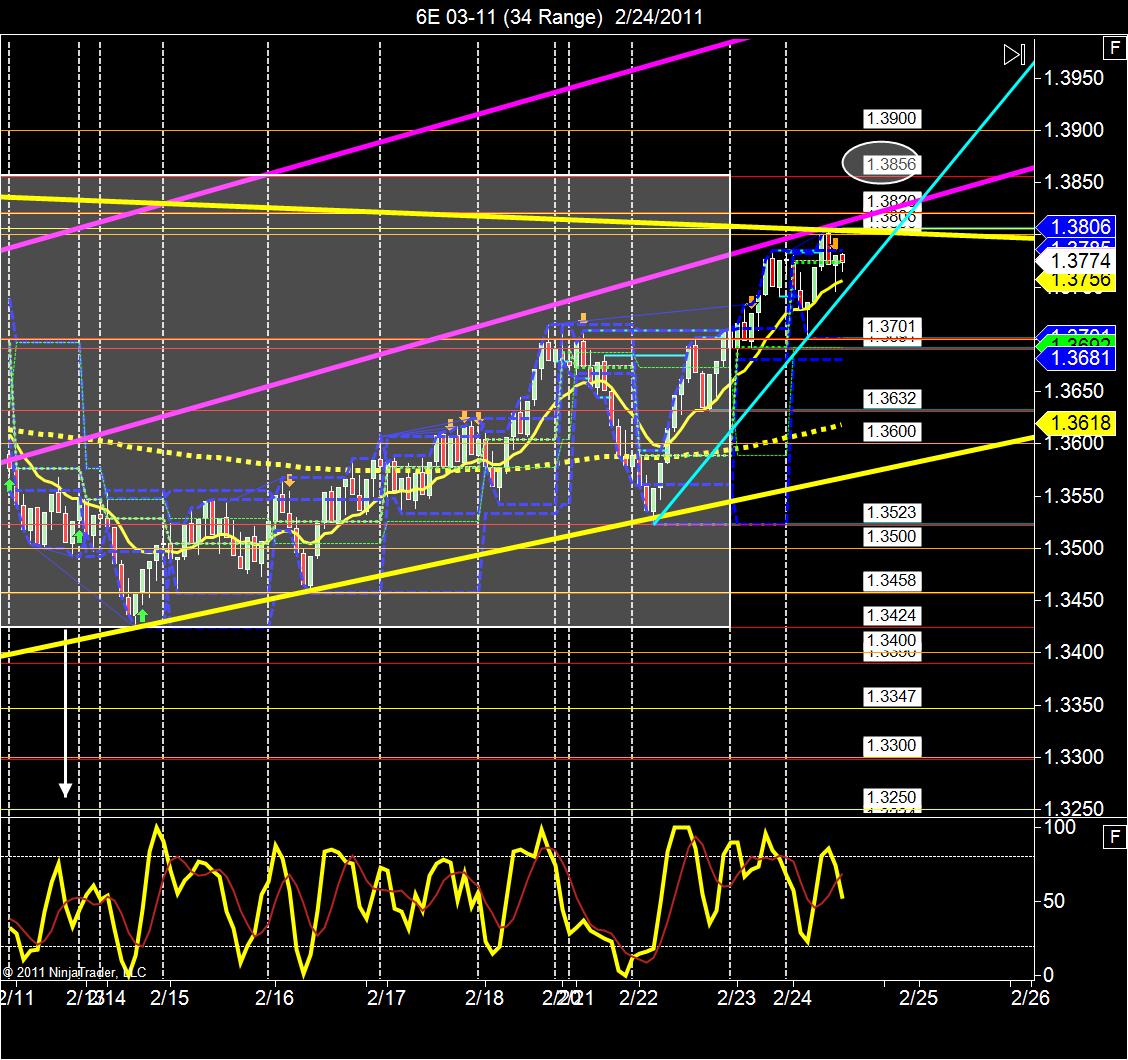
Our first concern is the light blue trend line with the very narrow price wedge, the best trades will occur AFTER we get out of this wedge, so be patient.

looking to buy the lows of the range of 1.3701, and sell the highs of the sideways range at 1.3800.

seeing the trend line at 1.3800 we need to beware that may be sloppy at the highs, so trade carefully.

if the euro keeps rising, the best opportunity is to buy a pullback above 1.3856, let price get out above the highs of this sideways range.

E-mini Russell Futures


    schooloftrade

    Click Here to Leave a Comment Below

    Leave a Reply: