July 27, 2010
Trend Lines for Day Trading Futures Contracts Crude Oil Gold Euro E-mini Russell ES

Hi guys!
Did you know Trend Lines are one of the oldest and most commonly-used technical indicators among day traders, scalpers, and even swing traders?
Trend lines are one of the most important aspects of our day trading because of the following reasons:
1. It DEFINES the trend of the hour, day, week, month, and we will use that trend to enter trades in the future
2. It defines the STRENGTH of the trend we are watching which will help us with future trading decisions
3. It defines FUTURE levels of support and resistance, which we will use to make PROFIT.
Here are some basics on using trend lines…
• One of the oldest forms of technical analysis
• Used for ANY type of trader
– Scalpers
– Day Traders
– Swing & Position traders
• Based on the idea that the markets move in ‘trends’
• Can be drawn on price charts of ANY kind
• Can also be drawn on indicators
• Trend Lines show 3 distinct pieces of important information for day traders:
– Direction of the current price trend (up or down, long or short)
– Strength of the current price trend (steep trend line? Flat trend line?)
– And the Future support or resistance of the price trend (where is the next trend line?)
Wedge Pattern using trend lines:


trade the breakout of the wedge pattern…

Buy the lows and sell the highs of the wedge…but stay away from trading the middle of the wedge…
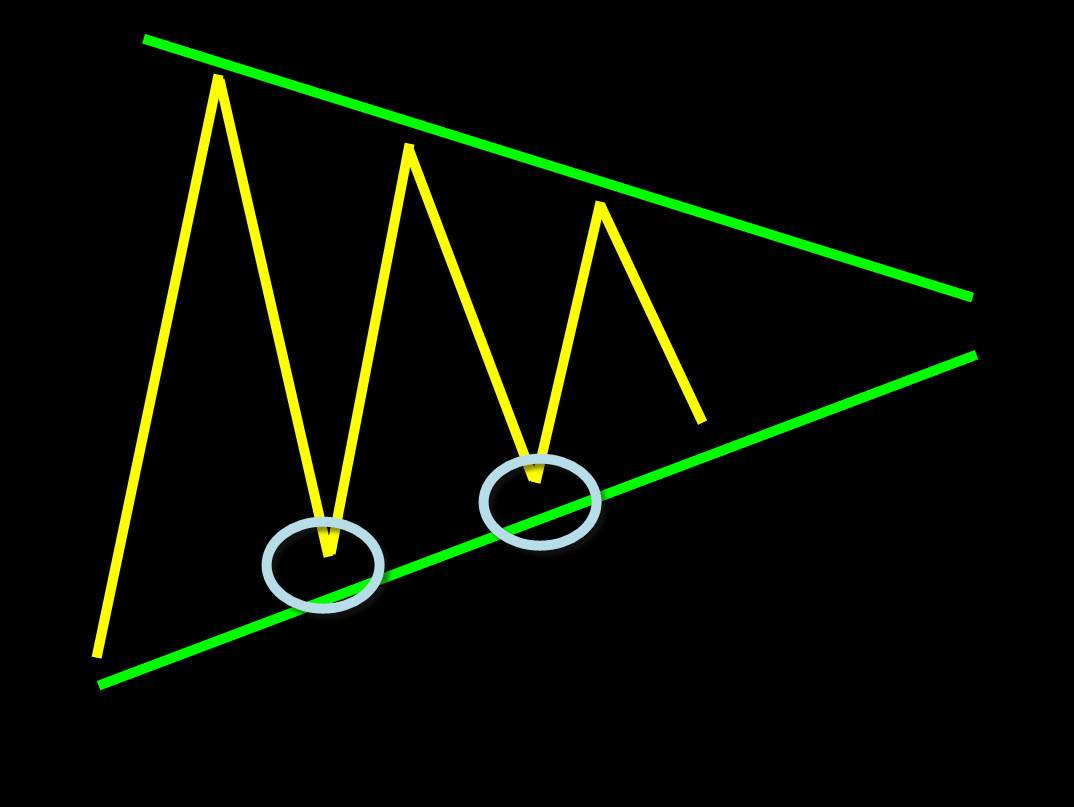
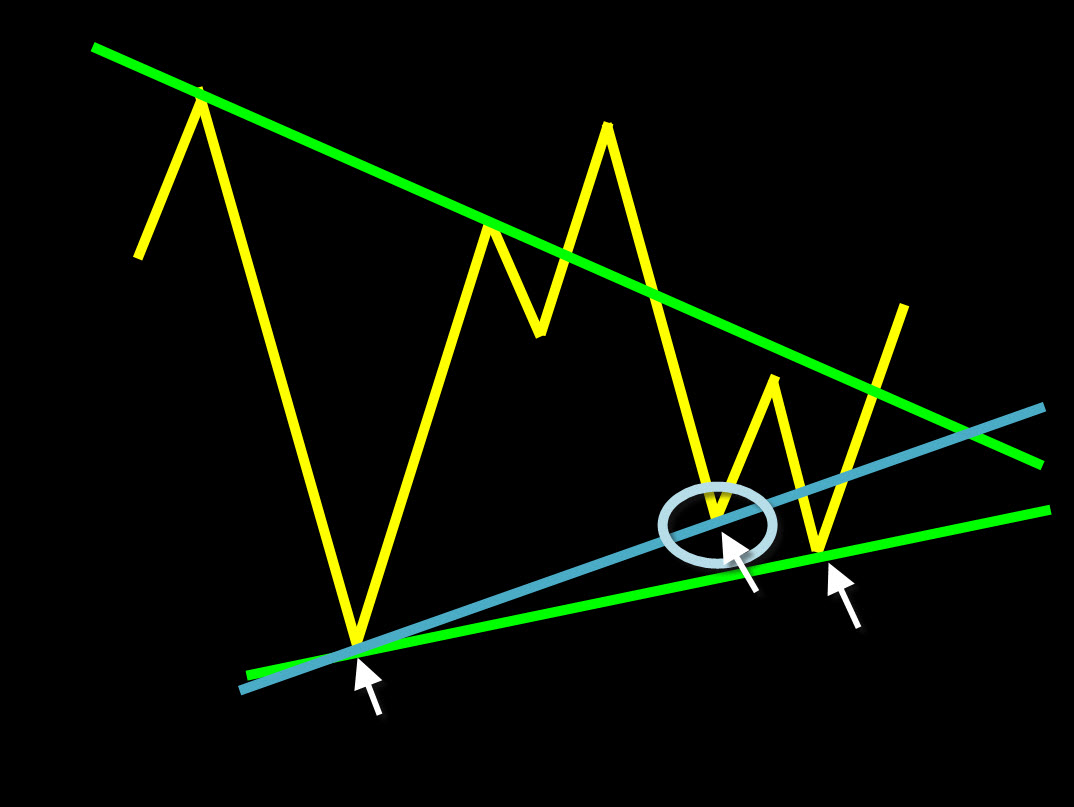
dont forget to look for ‘hidden’ trend lines that appear within the previous swing highs and lows, these will be added support and resistance that may surprise your next trade…
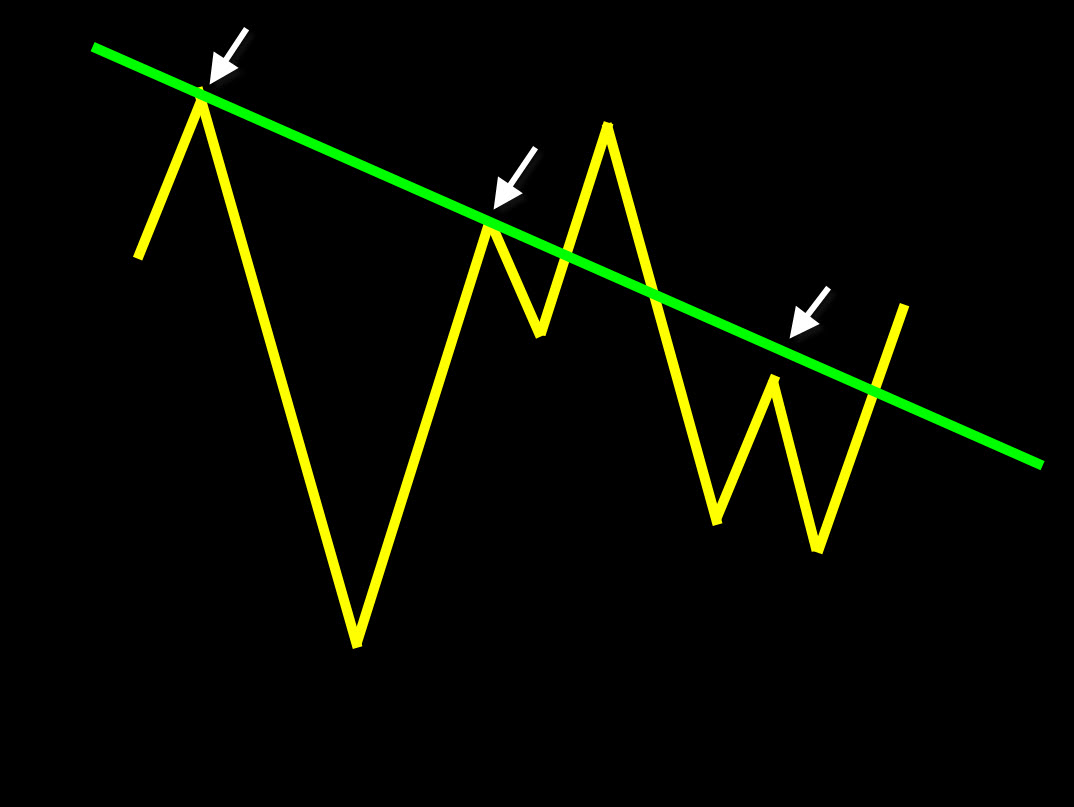
Make sure you get all of those trend lines…
and dont forget, trend lines may show up horizontal as well…we call this a sideways market, or range-bound market…
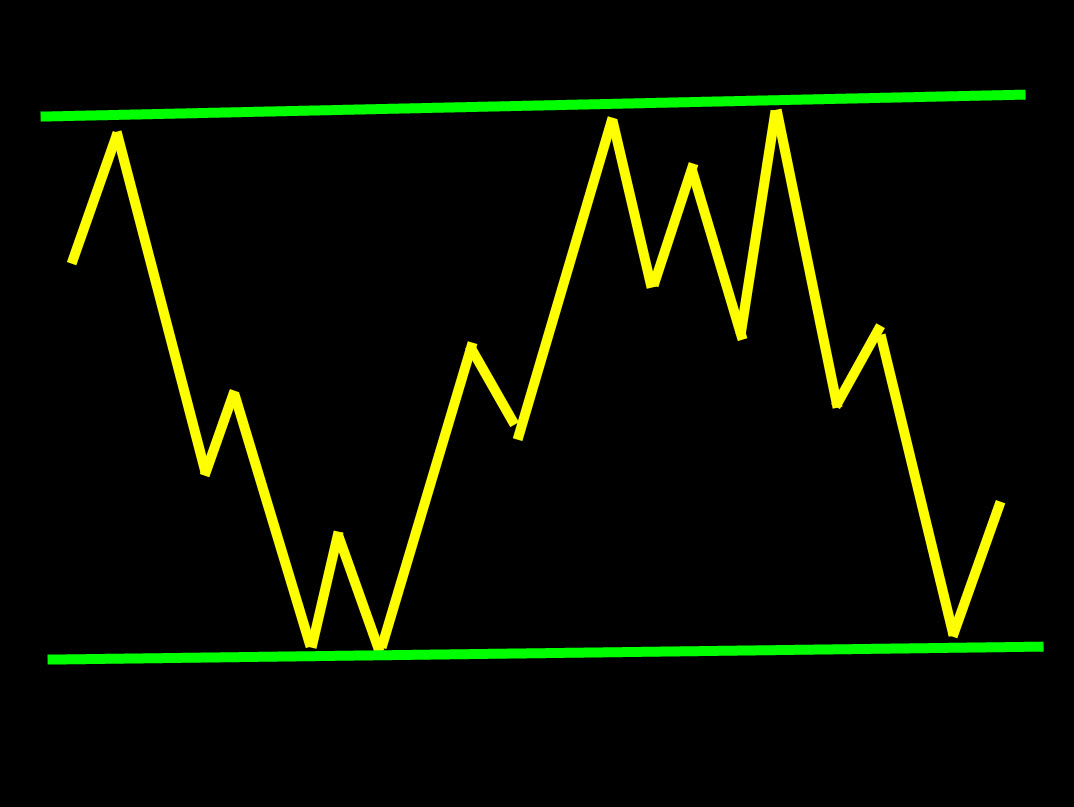
sideways markets are some of the EASIEST markets to trade, but you need to know how to trade them. You can learn more about sideways markets by clicking here!
• We draw these trend lines during our morning routine
• More info in the Beginner’s Course
• Begin with the slower timeframe chart first (34-Range, 30-min)
• Then move to faster charts (4-Range, 2-min)
• Mark from the lows, mark from the highs
• And don’t forget the ‘hidden’ trend lines J
here are some helpful videos to watch on TREND LINES: