January 28, 2014
- in Uncategorized by schooloftrade
When Bad is Good News for the Markets; Nightly-Newsletter 01/28/14; SchoolOfTrade.com

Having Trouble Watching? PLEASE WATCH HERE.
“Success is not measured by the position
someone has reached in life, or the paycheck they cash every other Friday.
We measure our success by the obstacles we
have overcome to get to where we are today.”
Reflections from Today:
·
Markets
rebound after 3 days of losses, ending today in the green
Markets
rebound after 3 days of losses, ending today in the green
·
Bad
news = Good News = Markets rally on “No Taper” by the Fed
Bad
news = Good News = Markets rally on “No Taper” by the Fed
·
More
bearish economic news in the US
More
bearish economic news in the US
·
Durable
Goods Orders drop sharply
Durable
Goods Orders drop sharply
·
Consumer
Confidence continues to rise
Consumer
Confidence continues to rise
·
Gold
ended flat after rebounding from losses (-0.06% @ 1255.6)
Gold
ended flat after rebounding from losses (-0.06% @ 1255.6)
·
Mini-Russell
stayed inside yesterday’s range, higher (+1.75% @ 1141.6)
Mini-Russell
stayed inside yesterday’s range, higher (+1.75% @ 1141.6)
·
Crude
Oil traded up to weekly highs (+1.60% @ 97.17)
Crude
Oil traded up to weekly highs (+1.60% @ 97.17)
·
APPLE
down today 7.3% as consumer ease off the iPhone
APPLE
down today 7.3% as consumer ease off the iPhone
·
FORD
reported earnings today +90% year-to-year
FORD
reported earnings today +90% year-to-year
·
FOMC
day is tomorrow, Wednesday 29th @ 2pm EST
FOMC
day is tomorrow, Wednesday 29th @ 2pm EST
·
Gold
contract rollover on Friday 31st
Gold
contract rollover on Friday 31st
·
Chinese
New Year on Friday 31st
Chinese
New Year on Friday 31st
·
President
Obama to issue the ‘State of the Union Address’ tonight 8pm EST
President
Obama to issue the ‘State of the Union Address’ tonight 8pm EST
Economic News for Tomorrow:
Will the Fed
make any changes to their ‘taper-talk’ from end of 2013? Will the Fed use the last week of poor
economic news as an excuse to postpone the threat of tapering in tomorrow’s
FOMC announcement? Traders around the
world will be watching closely to see what happens tomorrow afternoon at 2:00pm
EST.
make any changes to their ‘taper-talk’ from end of 2013? Will the Fed use the last week of poor
economic news as an excuse to postpone the threat of tapering in tomorrow’s
FOMC announcement? Traders around the
world will be watching closely to see what happens tomorrow afternoon at 2:00pm
EST.
Tomorrow is
known as ‘FOMC Day’ or ‘FED Day’ for day traders because the end of the 2-day
meeting culminates with a big announcement on Wednesday which will outline the
monetary policy of the US Federal Reserve Bank.
known as ‘FOMC Day’ or ‘FED Day’ for day traders because the end of the 2-day
meeting culminates with a big announcement on Wednesday which will outline the
monetary policy of the US Federal Reserve Bank.
Remember,
this event only happens 8 times every year in Washington with all the Fed
Governors from the 12 Federal Reserve District Banks around the country which
makes this one of the most important days of the YEAR.
this event only happens 8 times every year in Washington with all the Fed
Governors from the 12 Federal Reserve District Banks around the country which
makes this one of the most important days of the YEAR.
Tomorrow
morning we have Crude Oil inventories at 1030am EST which is going to be tough
on Crude Oil traders because we typically see sloppy price-action on Wednesdays
ahead of the inventory release, and then after 1030am we usually get some great
trading opportunities. Tomorrow we will be very careful trading Crude Oil before
the 1030am news is released, and then after 1030am we are going to have to see
how the market-personality looks going into the 2:00pm EST release of the FOMC
Announcement.
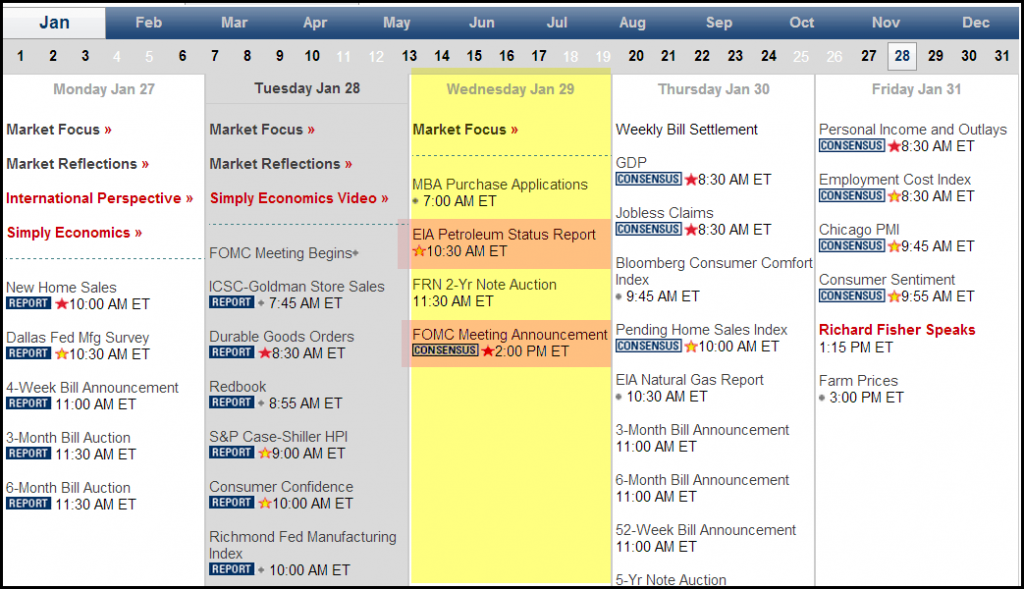
10:30am EST: Crude
Oil Inventories
Oil Inventories
2:00pm EST: FOMC
Meeting Announcement (Red-Star news)
Meeting Announcement (Red-Star news)
Day trading plan for Tomorrow:
Crude Oil:
VIP Chart:
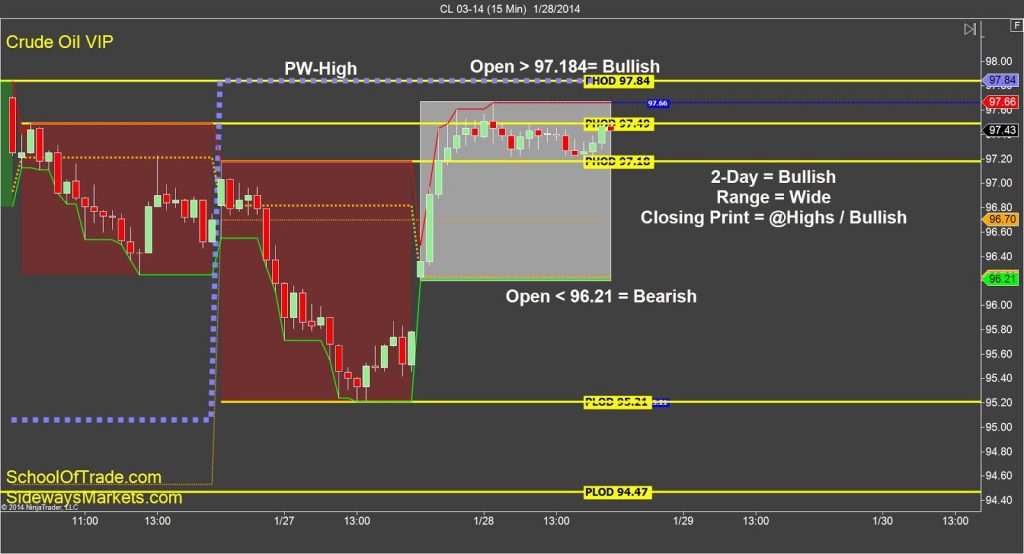 |
| Crude Oil VIP Chart |
Crude Oil traded higher today almost up to last week’s high
at 97.84. We see a bullish 2-day
relationship, a wide trading-range, and a very bullish closing-print.
at 97.84. We see a bullish 2-day
relationship, a wide trading-range, and a very bullish closing-print.
If we open tomorrow above the 97.84 weekly highs we are very
bullish and we will be focused on buying.
bullish and we will be focused on buying.
If we open tomorrow below the 96.21 we are bearish and will
sell short down to a profit-target at 95.21 and then 94.47.
If we open tomorrow inside today’s range we will then buy the
lows at 96.21, sell the highs at 97.84, and avoid trading in the middle around
96.80-97.00.
lows at 96.21, sell the highs at 97.84, and avoid trading in the middle around
96.80-97.00.
Anchor Chart:
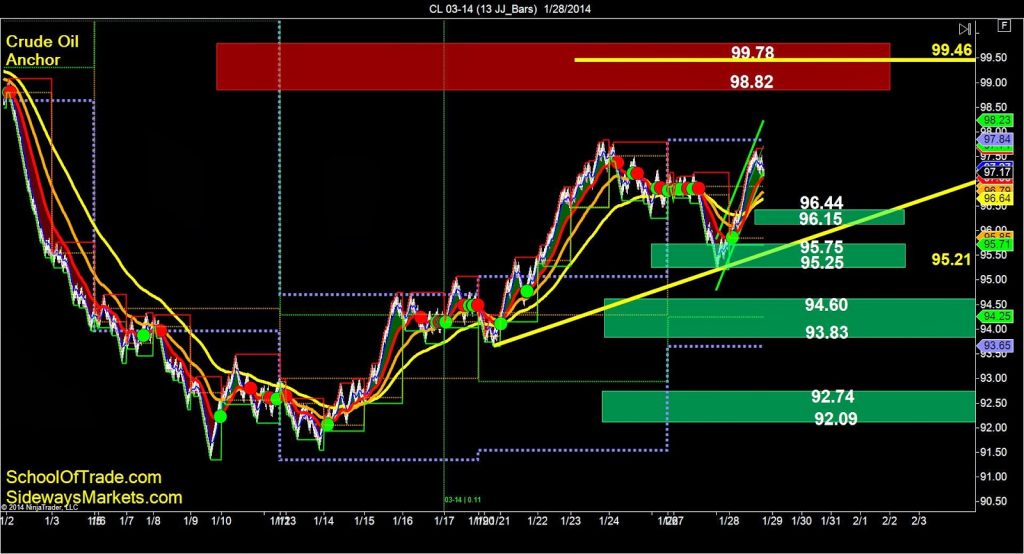 |
| Crude Oil Anchor Chart 1 |
Crude Oil is moving higher on the anchor chart this evening,
but I am waiting for price to pull back and give me an opportunity to buy this
at a discount before I get into the position long.
but I am waiting for price to pull back and give me an opportunity to buy this
at a discount before I get into the position long.
I have identified some key buying opportunities
at 96.44, 96.15, 95.75 and 95.25 if we can get price to come down a little
before going higher.
at 96.44, 96.15, 95.75 and 95.25 if we can get price to come down a little
before going higher.
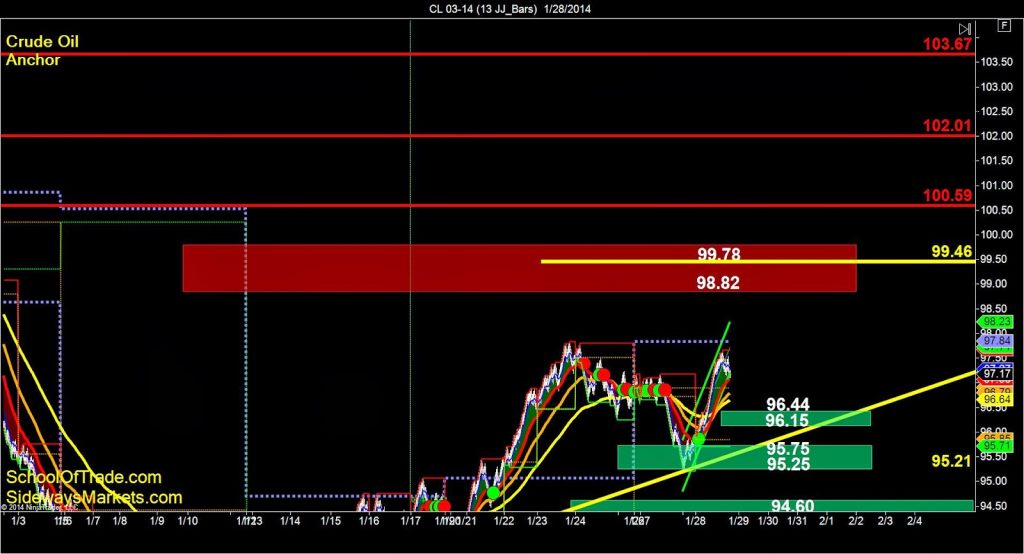 |
| Crude Oil Anchor Chart 2 |
Assuming I can get into a trade long on a pullback, I will
use the resistance levels overhead as easy profit-targets at 98.82, 99.46,
99.78, 100.59, 102.01, and 103.67.
use the resistance levels overhead as easy profit-targets at 98.82, 99.46,
99.78, 100.59, 102.01, and 103.67.
Gold:
VIP Chart:
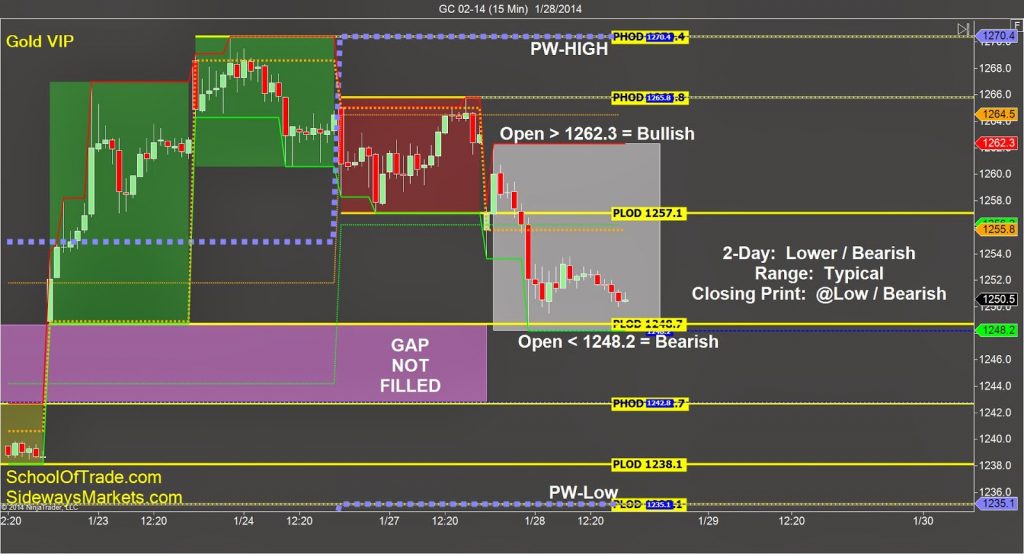 |
| Gold VIP Chart |
Gold pushed lower today, although on very light volume ahead
of tomorrow’s FOMC report. Remember, Gold
(and the dollar-index) will be the most-affected markets by FOMC, so it’s no surprise
to see Gold has been challenging to predict over the last few days.
of tomorrow’s FOMC report. Remember, Gold
(and the dollar-index) will be the most-affected markets by FOMC, so it’s no surprise
to see Gold has been challenging to predict over the last few days.
We see a bearish 2-day relationship, a typical trading-range,
and a very bearish closing-print near the lows of the session. These clues tell us to be looking for selling
opportunities going into this evening and tomorrow and the GAP below us from
1248.2 don to 1242.8 is looking mighty inviting to be filled with a short trade
this evening or tomorrow morning.
and a very bearish closing-print near the lows of the session. These clues tell us to be looking for selling
opportunities going into this evening and tomorrow and the GAP below us from
1248.2 don to 1242.8 is looking mighty inviting to be filled with a short trade
this evening or tomorrow morning.
If we open below 1248.2 I am selling short down to profit-targets
at 1242.8, 1238.1, and 1235.1.
at 1242.8, 1238.1, and 1235.1.
If we open above the 1262.3 I am buying long up to profit-targets
at 1265.8, 1270.4 and possibly even higher if the market-personality is very
bullish and strong.
at 1265.8, 1270.4 and possibly even higher if the market-personality is very
bullish and strong.
I will expect tomorrow morning to be challenging for day
trading Gold because all eyes will be focused on 2pm EST and the FOMC
announcement.
trading Gold because all eyes will be focused on 2pm EST and the FOMC
announcement.
Anchor Chart:
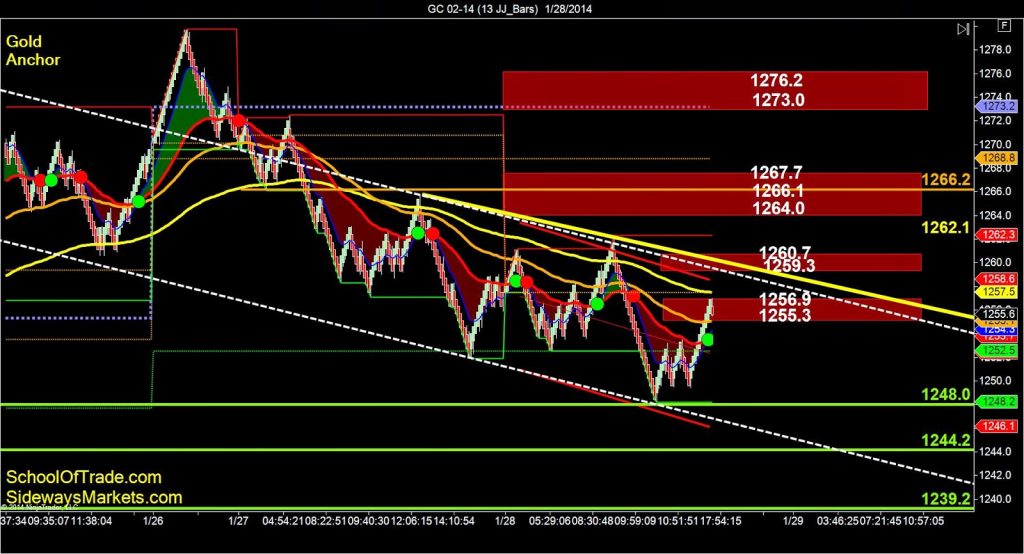 |
| Gold Anchor Chart |
The anchor chart of Gold is VERY bearish this evening and we
have a strong bearish price channel with a red cloud and almost below all the
key moving-averages. All of these clues
tell us that we have the green light to get SHORT whenever we see the next
entry pattern to get us into the trade.
have a strong bearish price channel with a red cloud and almost below all the
key moving-averages. All of these clues
tell us that we have the green light to get SHORT whenever we see the next
entry pattern to get us into the trade.
My goal is to sell at a premium (resistance) so I am looking
for selling opportunities at overhead resistance levels starting with 1255.3,
1259.3 1264.0 and even 1273.0.
for selling opportunities at overhead resistance levels starting with 1255.3,
1259.3 1264.0 and even 1273.0.
If I can get into a short position this evening or tomorrow
morning I will use the support levels below me as profit-targets at 1248.0,
1244.2, 1239.2, and then all the way down to the previous week lows at 1230.8
morning I will use the support levels below me as profit-targets at 1248.0,
1244.2, 1239.2, and then all the way down to the previous week lows at 1230.8
Mini-Russell:
VIP Chart:
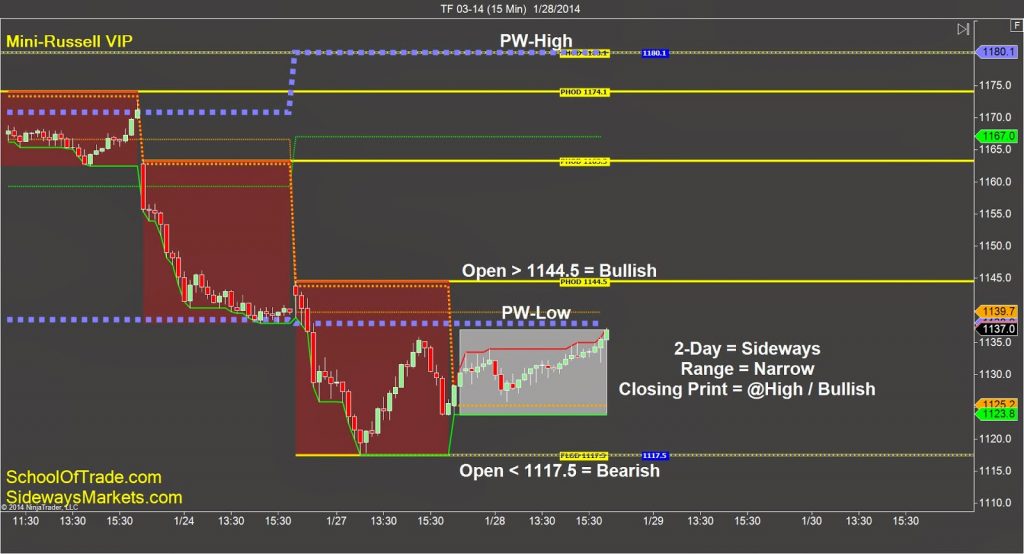 |
| Mini Russell VIP Chart |
Don’t let this narrow trading-range on the Mini-Russell fool
you this evening on the VIP Chart because this market was a very easy to make
profit today if you knew which patterns to look for. We had an incredible day of trading this
market in our Live Trade Room.
We see a consolidating 2-day relationship, a very narrow trading-range,
and a very bullish closing-print at the highs of today’s range. These three clues suggest that tomorrow will
be a BIG RANGE day, but we may get stuck on this previous week low at 1238.0
before we see it go anywhere.
and a very bullish closing-print at the highs of today’s range. These three clues suggest that tomorrow will
be a BIG RANGE day, but we may get stuck on this previous week low at 1238.0
before we see it go anywhere.
If we open above the 1144.5 I am buying long with profit-targets
above me 1163.5, 1174.1, and the previous week highs at 1180.1
above me 1163.5, 1174.1, and the previous week highs at 1180.1
If we open below the 1117.5 (Monday’s low) I am selling short
and using the support levels below as profit-targets at 1105.3, 1095.8, 1091.1,
1074.0
and using the support levels below as profit-targets at 1105.3, 1095.8, 1091.1,
1074.0
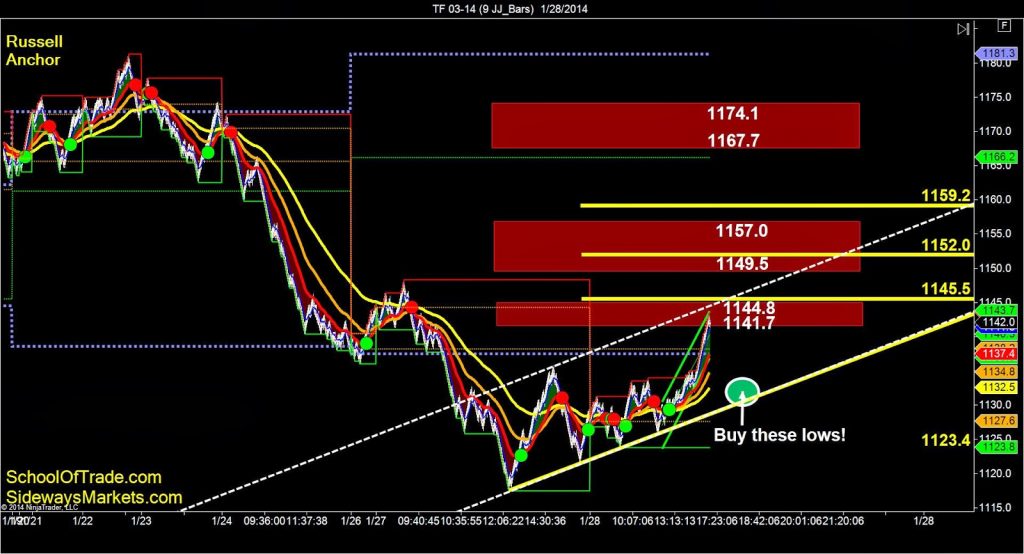
Anchor Chart:
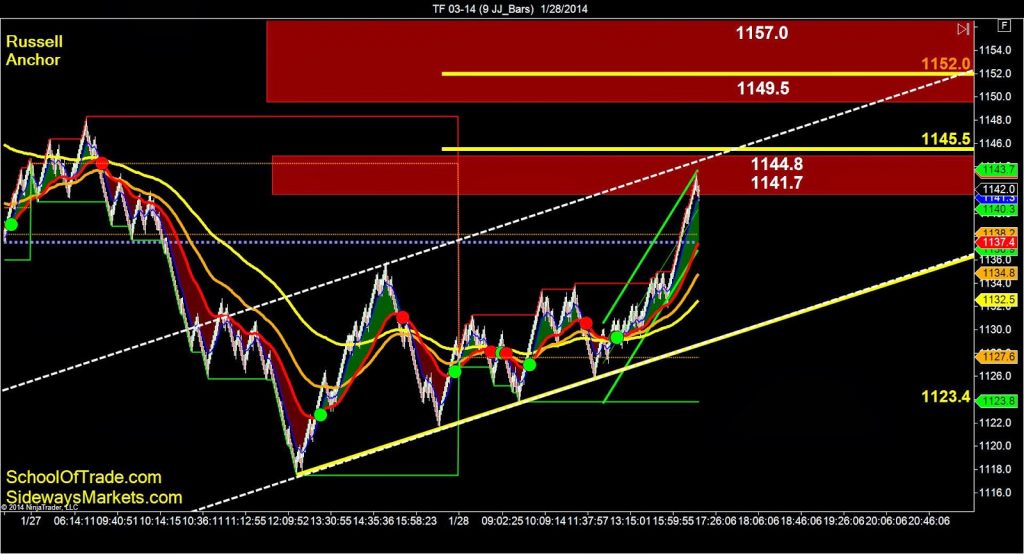 |
| Mini Russell Anchor Chart 1 |
The anchor chart of the Mini-Russell is an excellent example
of a market is overbought and priced at a ‘premium’. We are clearly bullish with higher-highs and higher-lows
as well as being above the key moving-averages on this anchor chart. The only concern we have right now is that we
NEED to see this price pull back off these highs before we try to buy it this
evening or tomorrow morning.
The ideal location to get long on the Mini-Russell is at the
lows of this price channel around 1134.0 – 1136.0. It’s hard to say exactly where the lows of
the price channel will be tomorrow morning, but you can assume that if we push
higher we are going to be waiting for a pullback so that we can buy this market
at a DISCOUNT rather than at a PREMIUM.
lows of this price channel around 1134.0 – 1136.0. It’s hard to say exactly where the lows of
the price channel will be tomorrow morning, but you can assume that if we push
higher we are going to be waiting for a pullback so that we can buy this market
at a DISCOUNT rather than at a PREMIUM.
 |
| Mini Russell Anchor Chart 2 |
We have plenty of resistance levels overhead to use as profit-targets
if we can get into the trade long, just remember NOT to buy directly into any
of these levels overhead because then you are buying at a premium. Be patient and wait for this price-action to
come off these highs, and then when it regroups and pushes higher again you
have it exactly where you want it.
===========================================================
Want to see us trade LIVE?
Click here to register for the
Free Trial!
Click here to register for the
Free Trial!
Automated Trading Strategy; Let the
Computer do the trading
Computer do the trading
Are you a Crude Oil Trader? Click here to
trade Crude Oil
trade Crude Oil
Are you a Euro Trader? Click here to
trade Euro
trade Euro
Are you an E-Mini Russell Trader? Click here to trade
E-Mini Russell
E-Mini Russell
Are you a Gold Trader? Click here to trade
Gold
Gold
Join the Premier Live trade-room as an Advanced Member