We’ve made 240 ticks so far…here’s what we’re watching NOW!

Crude Oil Futures:
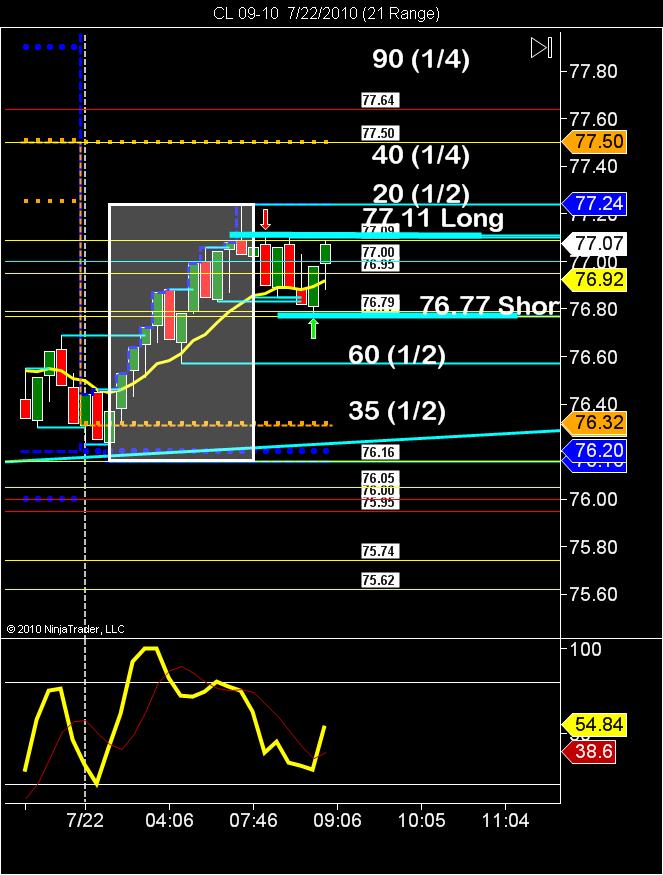
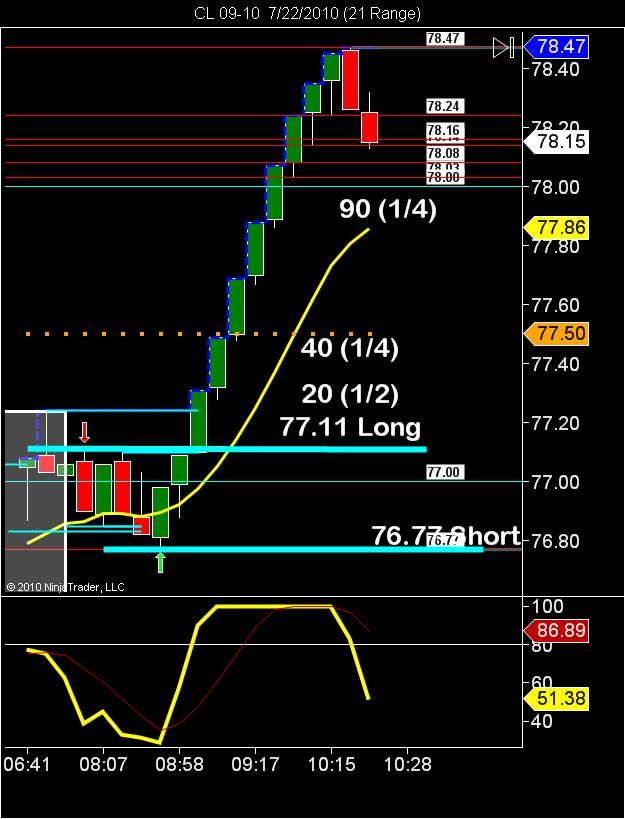
Our first trade of the morning triggered a lot faster than we expected, and we found ourselves in our breaker long entry on the 21-range chart.
– 900am EST long from 77.16 we took the breakout to the upside and held the entire move.
Now we see the market slowing down at these new highs, so we look for a reversal
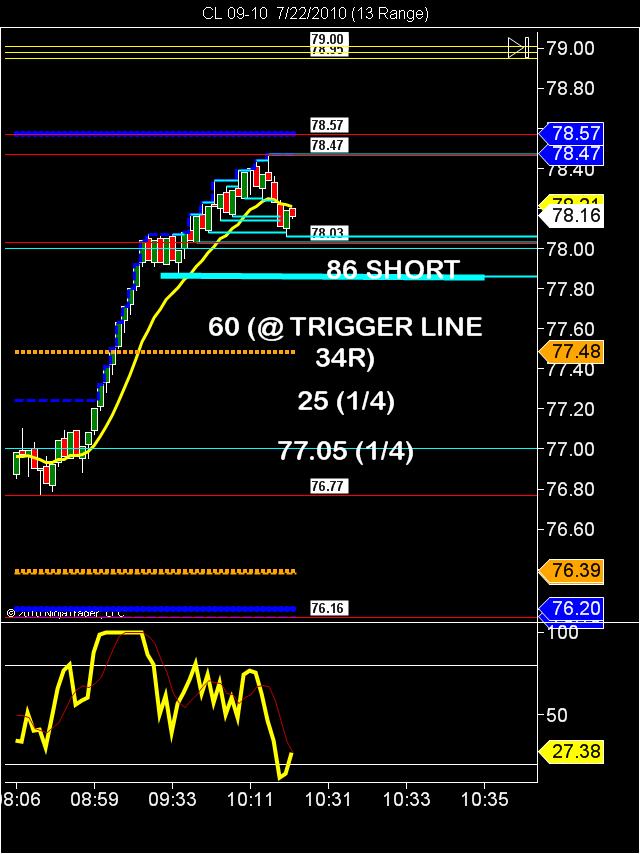
This time on a 13-range chart, little faster timeframe, but we can see a better pattern then the 21-range chart.
Entry short below 86, and then look at your 34-range trigger line for your first profit target.
– Trigger lines are dynamic indicators, so they are going to change so keep a close eye on that first target, it will be moving!
– My second target will be at 25, and my final target all the way at the lows of 77.05, just above the big round number.
21 Range Crude
21 Range Crude: Results
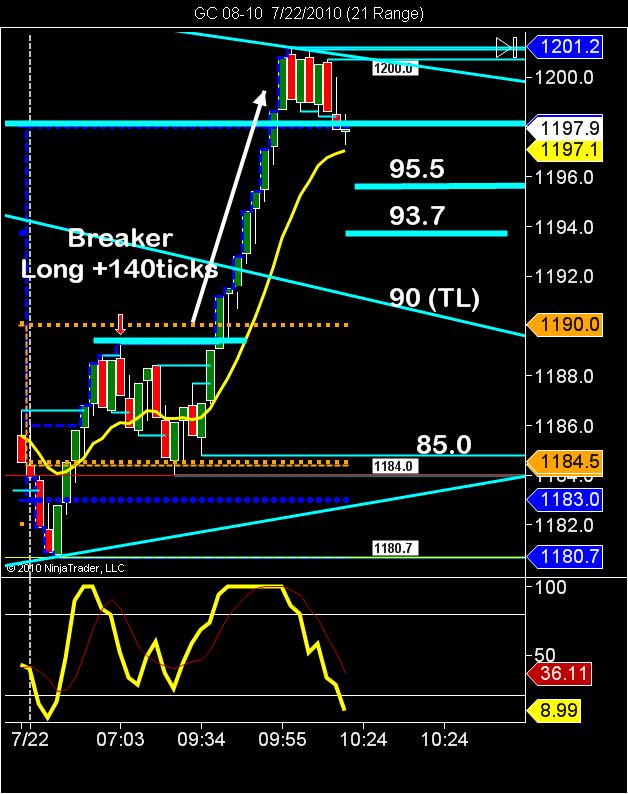
We already took 140 ticks out of the large move up on gold today.
We bought the gold futures contract @ 1191.6, and held all the way up to 1200.1 for a nice winning trade.
Now, just like with crude oil, we look for the reversal
We notice on gold that we are now at the extremes, the high of day for the passed 2 days, so lets look short for the reversal below 97.0, which is my trigger line on the 13-range chart
– Entry short below 97.0, looking for entry on the 4-range chart if you need it.
– My first target will be at 95.5, which is the most recent high of day from yesterday
– My second target will be 93.7, and my final target will take me all the way down to the open @ 85.0