Weather & Poor Economic News send markets higher | SchoolOfTrade Newsletter 02/18/14


Today:
Crude Oil; +236ticks @ 102.61
Crude
Oil keeps pushing higher w/ high volume (cold weather)
Gold; +201ticks @ 1322.2
Gold
pushes higher on poor economic news (bad weather)
Mini-Russell; +176ticks @ 1158.7
Equities
continue to find strength…shocker!
Empire
State Manuf Index; Big drop in ‘New Order’s
NAHB
Housing Market Index; largest EVER M/M decline
OPEX Week: 3rd Friday of the month
Contract Rollover on Crude Oil Futures
(04-14)
Feb
18, 1885; Mark Twain Publishes ‘The
Adventures of Huckleberry Finn
Feb
18, 1688; London Gazette publishes ‘Edward Lloyds Coffee House’ the birthplace
of Lloyds of London and the Insurance Industry
Wednesday: Housing
Starts, Producer
Prices, FOMC
Minutes
FYI: Crude Oil Inventories Thursday
@ 11am EST (Monday Holiday)
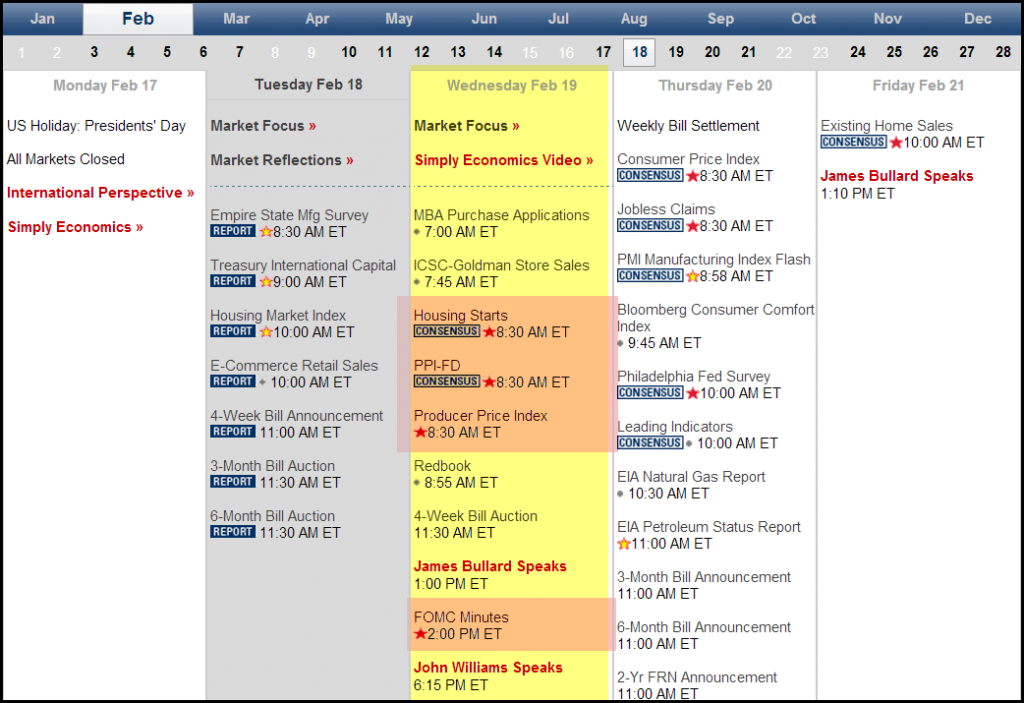 |
| Economic News Tomorrow |
Week for us day traders because it is the first day of OPEX-Week that we start
to see the impact of volume entering and exiting the market ahead of expiration
deadline at the end of the day on Friday.
News at 8:30am EST from Housing Starts and Producer Prices. Remember, this is RED STAR NEWS which means
we are looking for lots of trading opportunities to follow this news along with
big runner profit-targets and potentially a very big range day.
which are almost a month old, however, we will have to beware trading directly
into the 2:00pm release of this report, but we won’t use the report for very
much because it is month-old news.
a very active day with Wacky Wednesday on our hands!
Wednesday
Starts
Price Index
Meeting Minutes
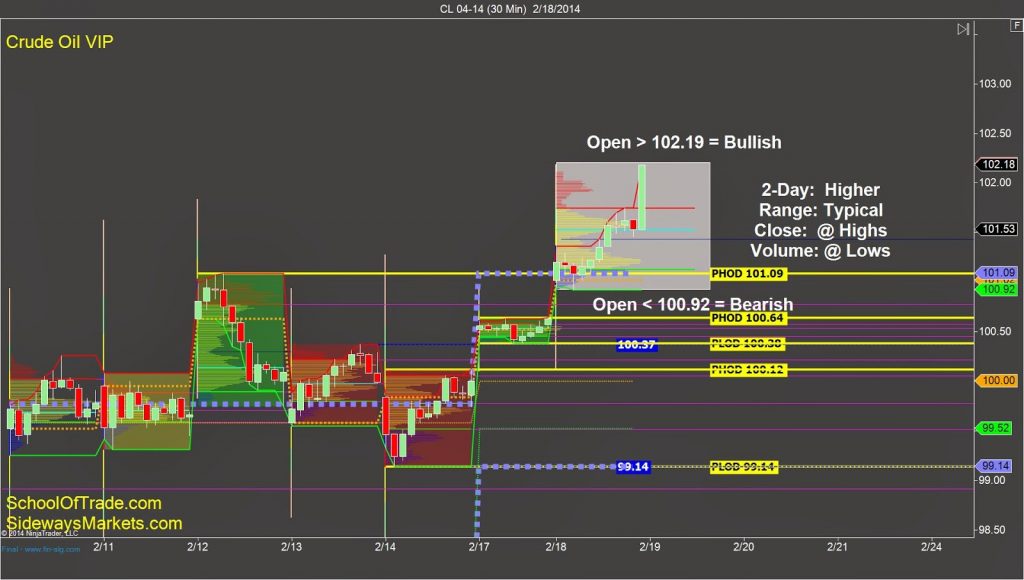 |
| Crude Oil VIP Chart |
VIP chart, but after further analysis we can see that the closing-print at the
highs was NOT supported by the volume-print at the lows of today’s range. This is a possible clue for a price-reversal going
into tomorrow, but as always, we never want to predict, we only will react if
prices try to push higher and fail…we will know exactly why.
on Wednesday is to look for buying opportunities above the 102.19 and selling
opportunities below 100.92.
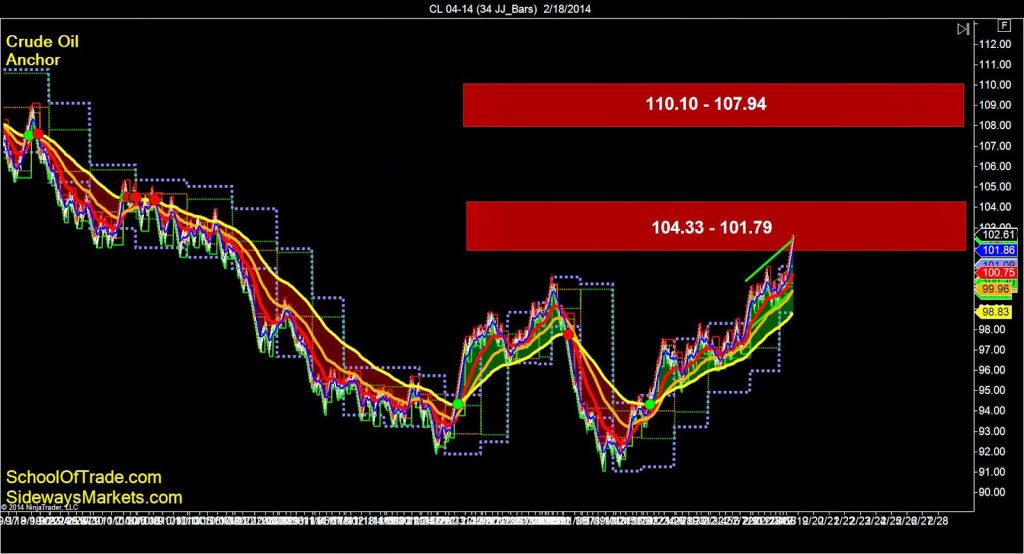 |
| Crude Oil 34-Anchor Chart |
Crude Oil pushed all the way up to the mid-point of the
larger trading-range from middle of 2013 and you can see on the 34-anchor chart
that we trading directly into some major resistance zones overhead at 104.33
down to 101.79. Has Crude Oil seen its
final bullish move this week? Will the resistance
hold and prices fall back to the big-round-number at 100.00? We will have to wait and see!
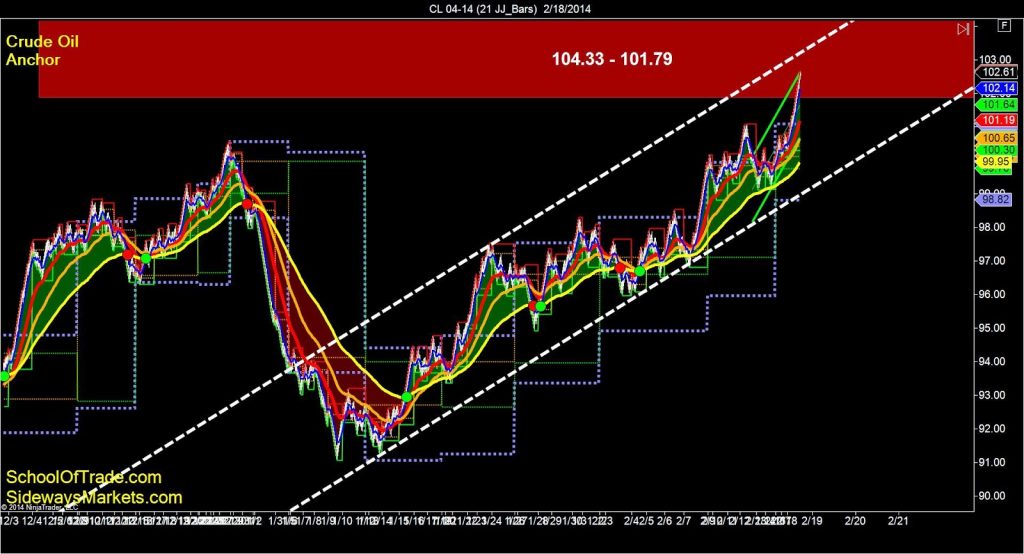 |
| Crude Oil 21-Anchor Chart |
highs of this short term bullish price channel.
This is a very important clue because it shows us that we do indeed
still have room to run higher all the way to the top of this price channel which
puts us up around the 103.00 – 103.50 area on this anchor chart. We look VERY over-bought on this anchor
chart.
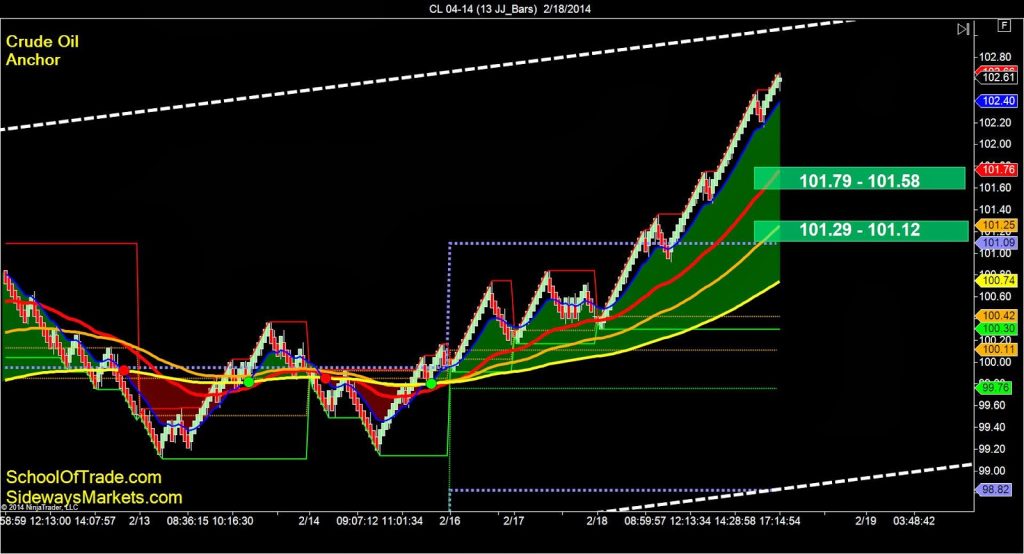 |
| Crude Oil 13-Anchor Chart |
details this evening. We can easily see
how over-bought Crude Oil is right now…which means I am going to wait for price
to pull back off these highs and try to get into a buying opportunity around
the 101.79 or 101.29 zones below us this evening and into tomorrow. Notice, if we get below the prior week highs
at 101.09 we may have a big selloff on our hands as we go lower back to the
100.00 big-round-number.
to wait patiently for price-action to pull back off these highs and I am
looking for buying opportunities at 101.79, 101.58, 101.29, and 101.12
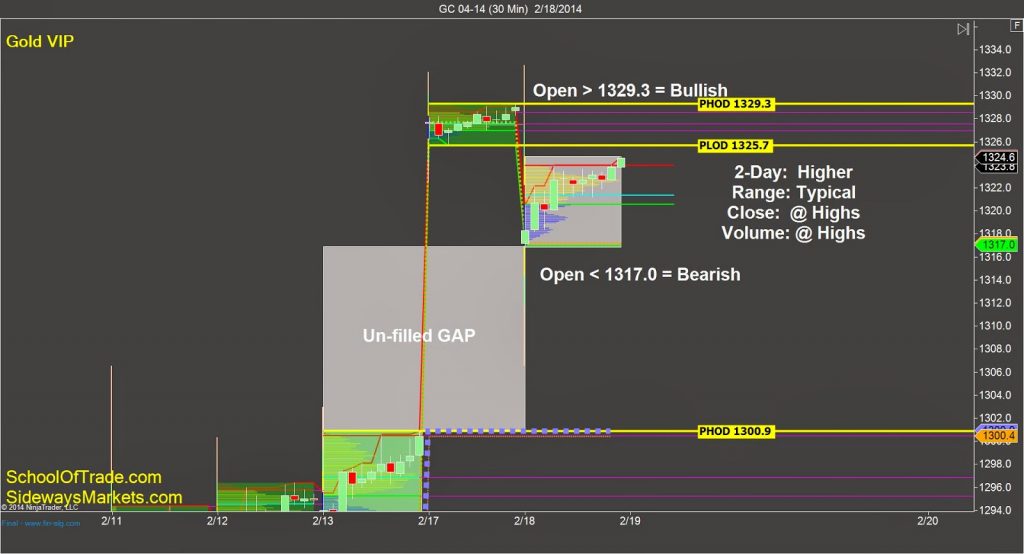 |
| Gold VIP Chart |
when we trade in our Live Trade Room, hehe, this price-action has been all over
the place and I LOVE IT! Notice the
volume-print up near the highs of today’s range, which is the biggest bullish
clue we get from this chart.
look for buying opportunities above the 1329.3, and selling opportunities below
the 1317.0 to fill the GAP we have below us.
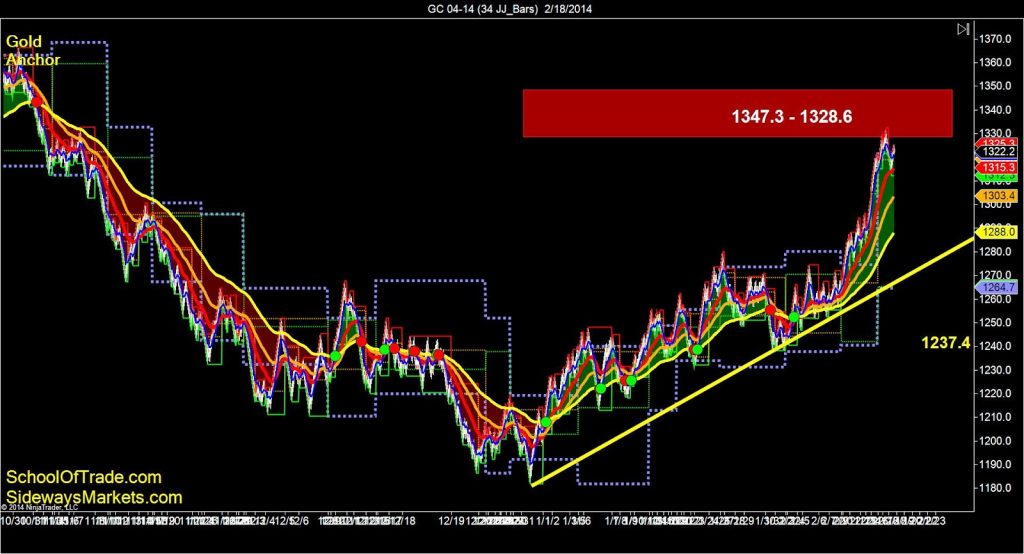 |
| Gold 34-Anchor Chart |
Gold has made a great run higher over the last 2 months, and
now we find gold trying to push through the sell-zone overhead at 1328.6 up to
1347.3 on our 34-anchor chart. We can
also see that Gold is VERY over-bought this evening and we could find some
excellent buying opportunities if we could get a pullback to the 1300.0 area on
the chart.
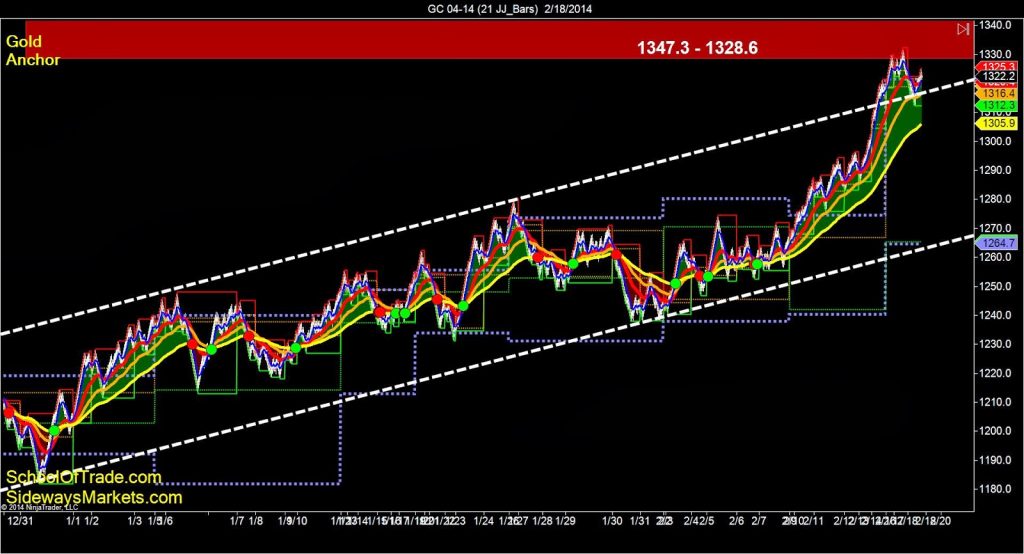 |
| Gold 21-Anchor Chart |
channel and price-action is currently trading right near the highs as we test
the sell-zone above at 1328.6. Notice,
we are at the highs of the price channel, and we have a LOT of room to pullback
before we get back in balance. This
anchor chart tells us to stay patient and wait for prices to pullback for the
easiest way to make profit following this trend.
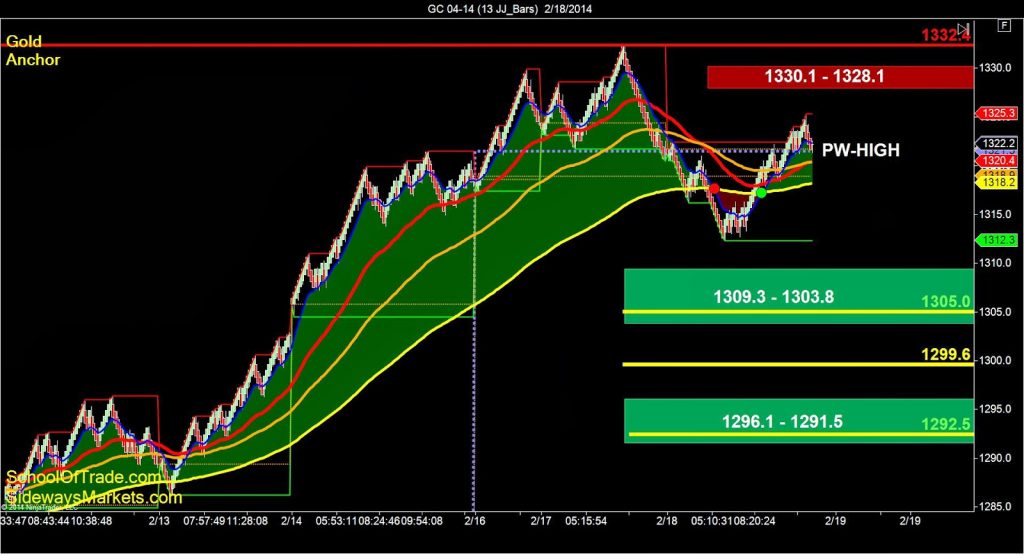 |
| Gold 13-Anchor Chart |
trend and most importantly it tells us that we need to stay away from trading
this area right now. Not only are we
over-bought on the prior anchor charts, now we see that price-action is
struggling to get away from last week’s highs at 1321.5. We don’t like trading around the ‘dotted
lines’ you see on this anchor chart, so this anchor chart tells us to sit-on-hands
and wait for tomorrows opening-bell.
overnight, or at the very least im waiting to get away from this prior week
highs. I will buy the zone at 1309.3 below
me, or sell the zone at 1328.1 above me…but remember…stay patient because this
whole area is toxic for day trading.
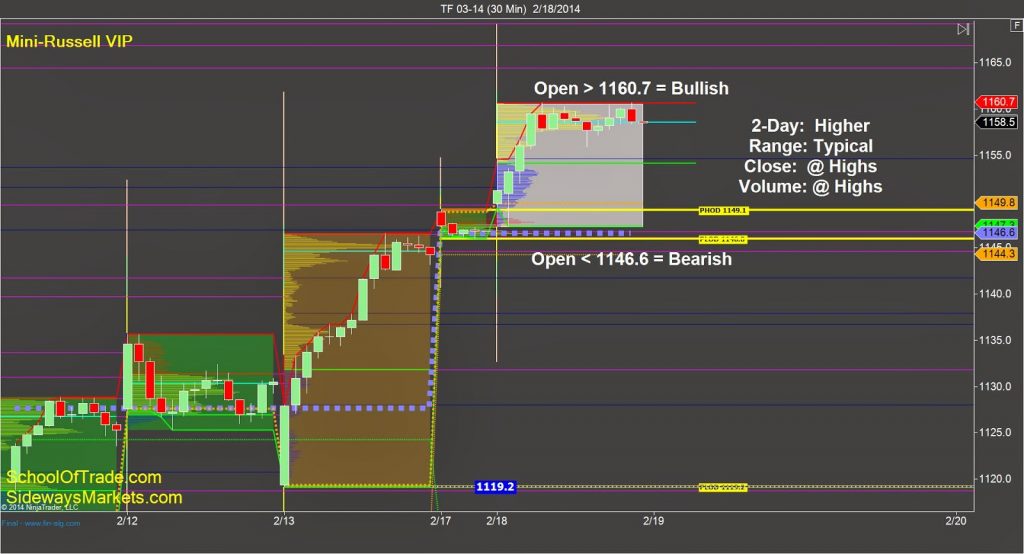 |
| Russell VIP Chart |
The Mini-Russell (along with the other equity markets) are
very bullish right now going into OPEX week here in the US. This VIP chart shows us BIG CLUES that the
buyers took control and never looked back today. Notice, the volume-print near the highs of
the range, suggesting that the most interest today (as well as last Friday I
might add) was right at the highs of the range.
is to look for buying opportunities above the 1160.7 or selling opportunities below
the 1146.6 because we have a big wide-open-space below us from 1146.6 down to
1119.2
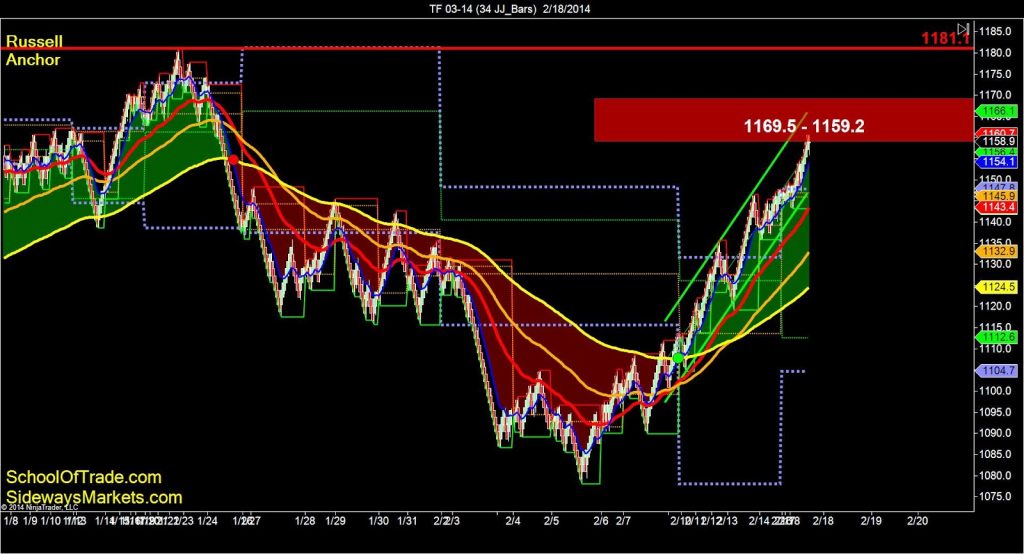 |
| Russell 34-Anchor Chart |
a major sell-zone directly overhead on the 34-anchor chart. In addition to being on top of this resistance
level we can also see that we are well over-bought at this time, which suggests
that it would be best to look for buying opportunities after we see a pullback overnight.
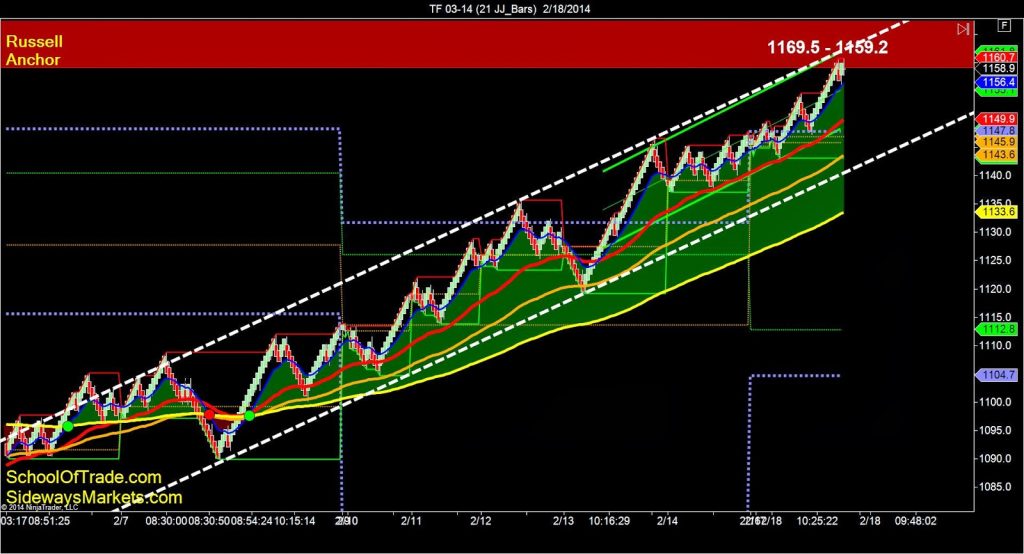 |
| Russell 21-Anchor Chart |
with a strong bullish price channel and trading right at the highs. This chart tells us once again that price-action
is over-bought and our best option would be to buy it after we pullback off
these highs. I would LOVE to buy the
lows of this bullish price channel if price-action can test the lows around the
1145.0 area this evening or tomorrow.
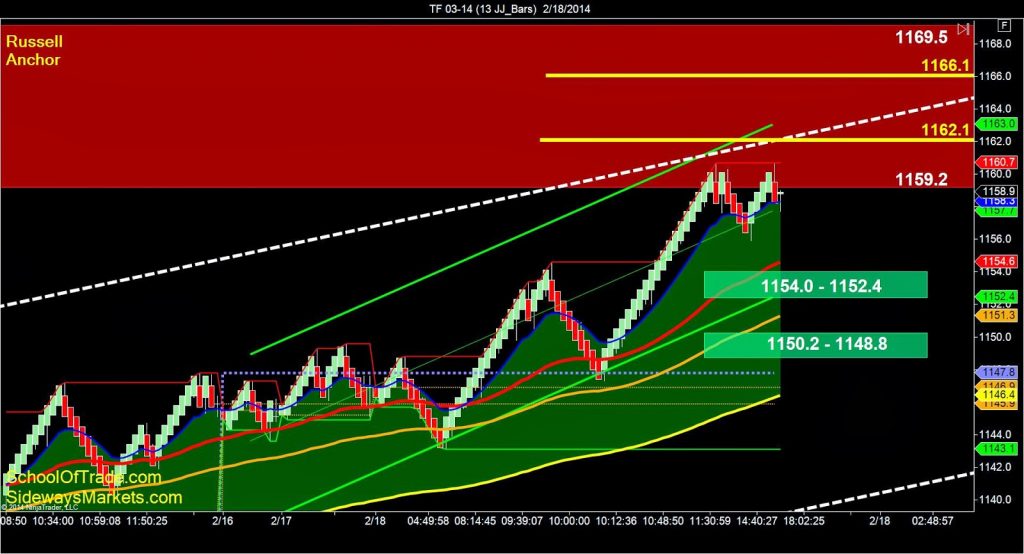 |
| Russell 13-Anchor Chart |
Mini-Russell this evening and into tomorrow.
We can see buy-zones at 1154.0 and 1150.2 so we have an easy target to
look for our next buying opportunity. I’ve
provided profit-targets overhead at 1162.1, 1166.1 and 1169.5, not to mention
the highs of the bullish price channel which may be a little higher/lower
depending on how long it takes to test those highs.
is to buy on a pullback to the 1154.0 or 1150.2 levels below us this evening
and into tomorrow. With a buying
opportunity tomorrow I am looking for profit-targets at 1162.1 and 1166.1 for
the easy money!
Click here to register for the
Free Trial!
Computer do the trading
trade Crude Oil
trade Euro
E-Mini Russell
Gold