- in Uncategorized by schooloftrade
day trading strategies for jobless claims and business inventories

We begin our day trading strategy with the dollar index 13-range chart. This will show me the short term trend, and we can see it sideways, forming a price wedge. Remember, a price wedge is a BIG clue and we need to stay away from the middle of the wedge, focusing our attention on patterns when the dollar index is at the highs or the lows of this wedge.

Crude Oil futures day trading strategy involves using multiple timeframes to plan our attack. We begin with the 89-range chart and this shows us a new price wedge, and we are in the middle of that wedge after seeing lower-than-expected jobless claims at 830am est this morning.

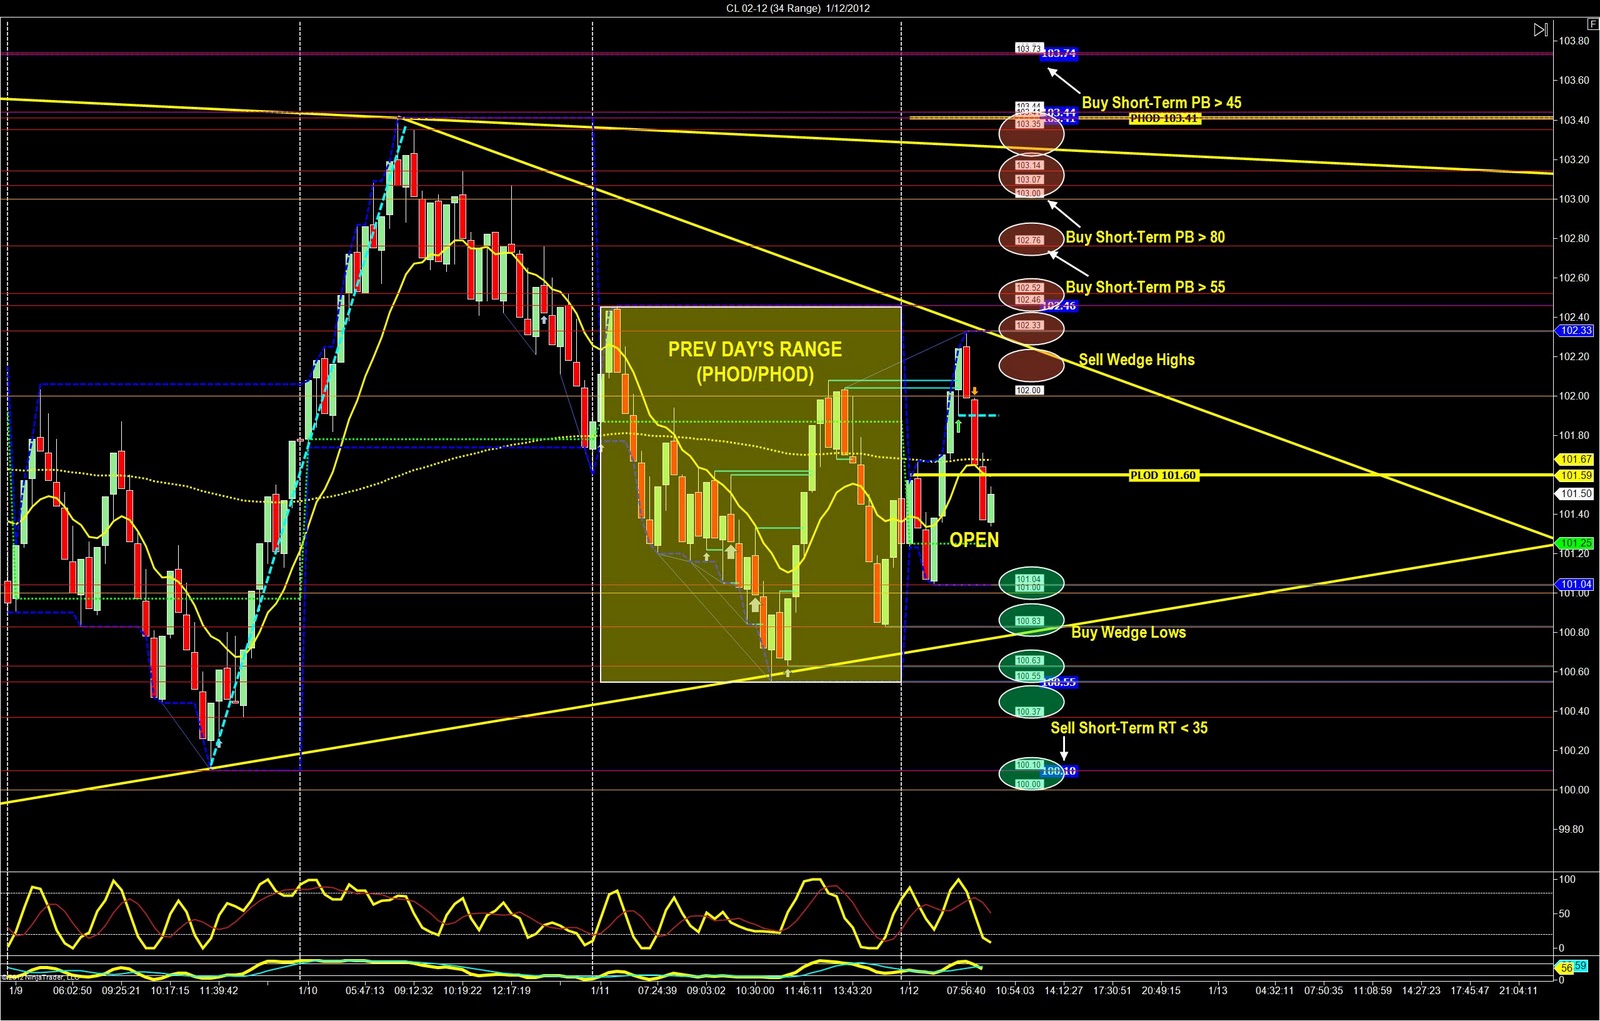
Crude Oil futures tumble off the price wedge highs after the jobless claims data, and we can use our 34range chart to plan our specific trading locations. We want to sell the highs and buy the lows of this wedge. Remember if price moves through the wedge highs we want to sell first, and then buy a pullback once resistance turns into support. If price moves below the wedge lows we buy the support and then sell a retracement as it turns into resistance.
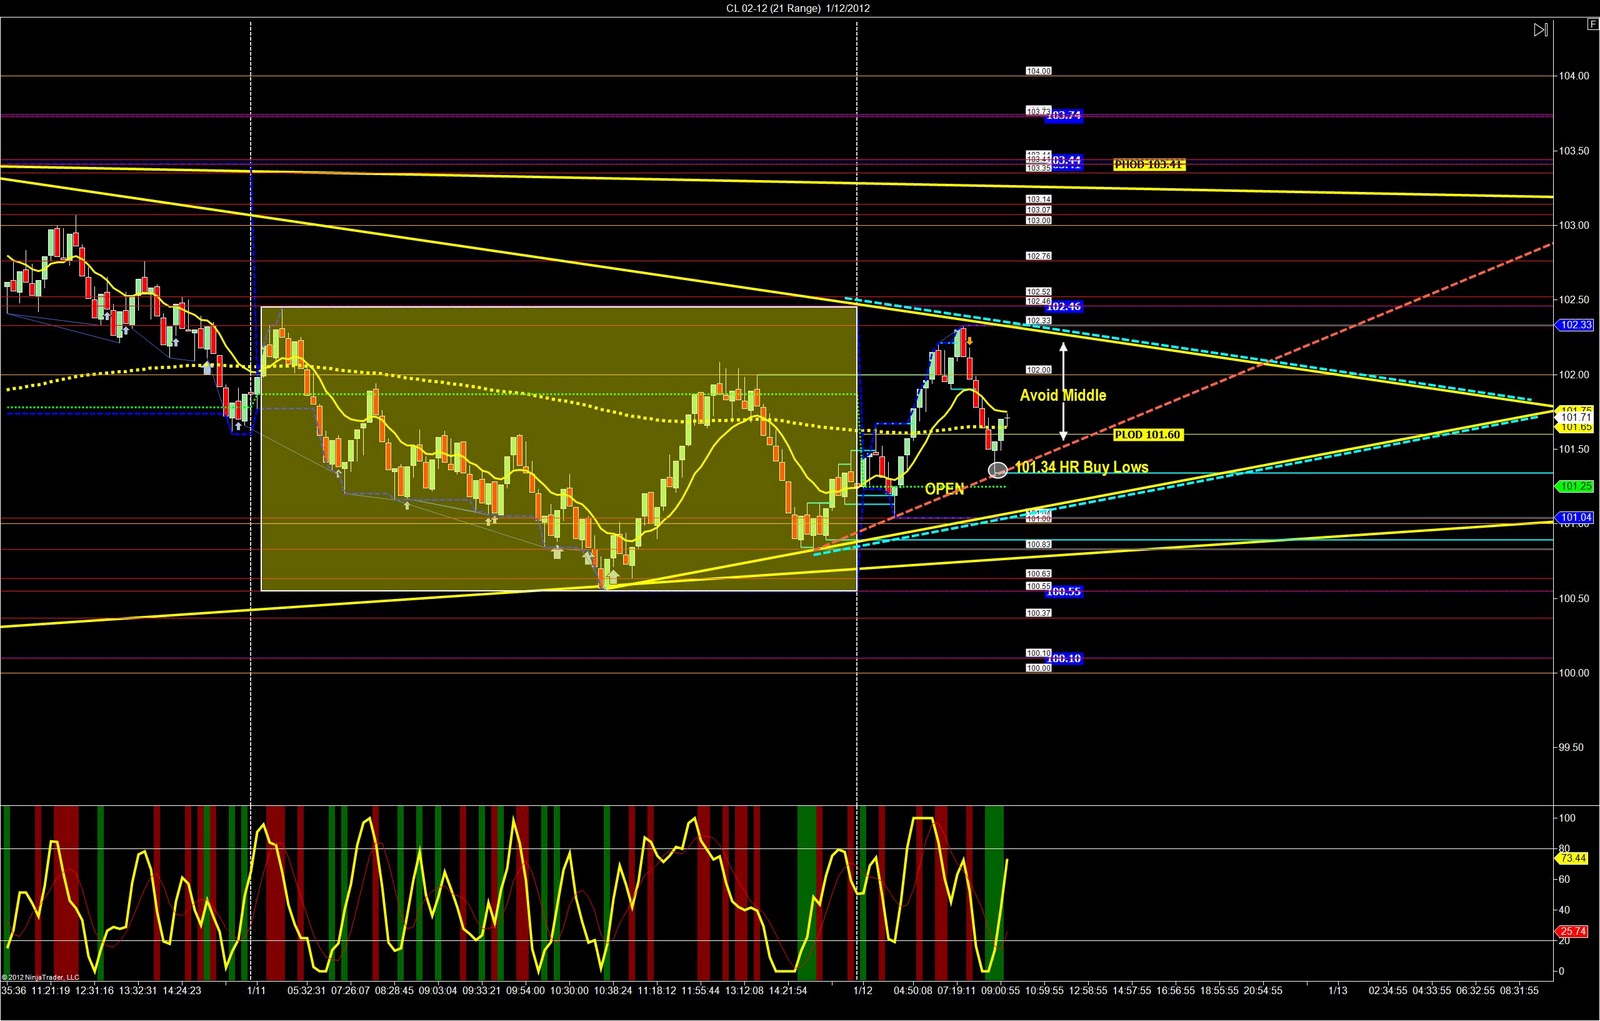
Our specific entry spots are confirmed and our day trading strategy is completed on the 21-range chart of the crude oil. We see a more narrowing price wedge and we get even more specifics for price entry locations when the trades set-up. The most important thing to remember in waiting for trades this morning is to avoid the middle, sell the 102.33-102.52 and buy the lows 101.34 (higher risk b/c of the open below) and the higher percentage buy will be 101.15-100.55.