May 30, 2014
- in Uncategorized by schooloftrade
Truth about Fibonacci Retracements, Projections and Extensions; SchoolOfTrade Tutorials

In this day trading tutorial we will discuss Fibonacci retracements, projections and extensions. In addition to learning the basics of these we will also share a day trading strategy that uses a combination of these.
Most day traders know about Leonardo Fibonacci, and his Fibonacci sequence, but most of the so-called ‘experts’ don’t know the difference between a Fibonacci retracement, projection, and extension.

The truth about Fibonacci Retracements, Projections and Extensions are that they are all very important for a professional day trader, but they do very different things.
Let’s begin with the most commonly-used form of Fibonacci, the Fibonacci retracement.
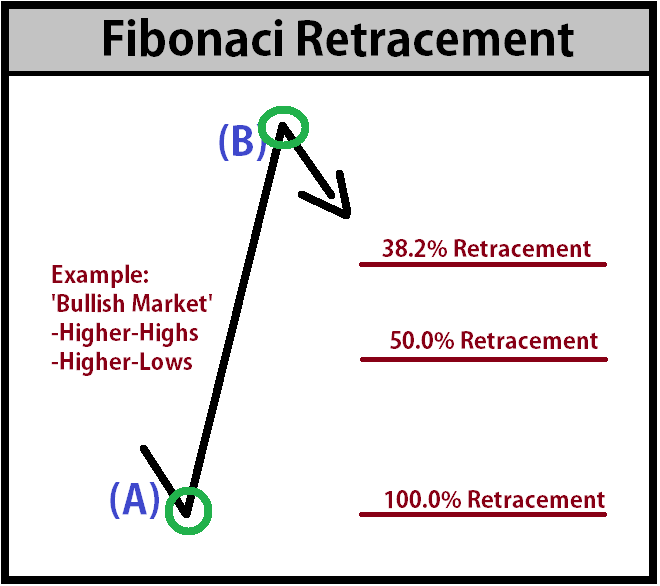
Fibonacci Retracement:
A Fibonacci retracement is simply a measurement from 2 points on a chart, which defines how far price has “retraced” off its recent high or low.
Drawing a Fibonacci retracement is very simple:
You only need 2 points on the chart to draw a Fibonacci retracement, and we will call these two points ‘A’ and ‘B’.
It helps to use charting software, such as Ninja Trader, to help you find major “swing-highs” and “swing-lows” to draw your Fibonacci retracements.
Make sure you draw the Fibonacci retracement in the direction that the price is moving, such as higher or lower. Also, remember to only use the most important swings on the chart.
Find the most obvious (major) swings in price-action on the chart, and draw the Fibonacci retracement from LOW to HIGH in a bullish market, or HIGH to LOW in a bearish market.
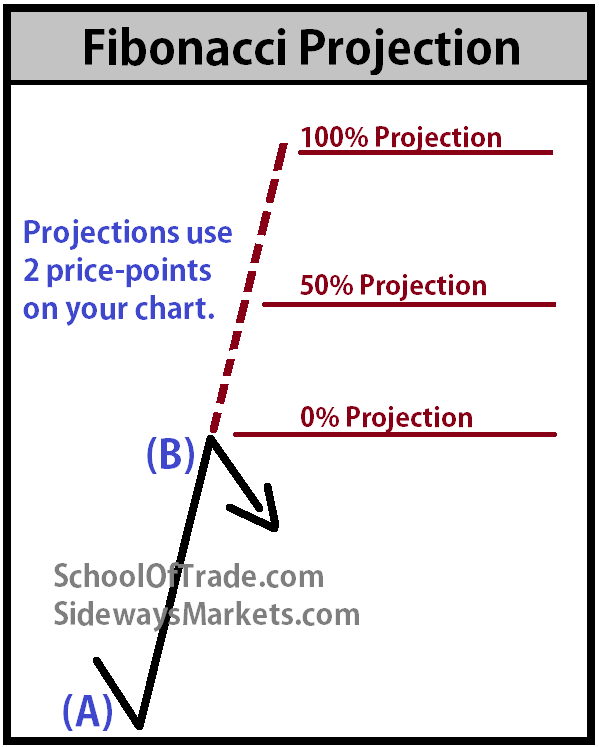
Fibonacci Projection:
A Fibonacci Projection is a measurement from 2 points on a chart, and the range between those two price-points is then ‘projected’ into the future to be used a support and resistance.
You only need 2 price-points on your chart to define a Fibonacci projection, and make sure you measure it in the same direction as the trend of the price-action on your chart.
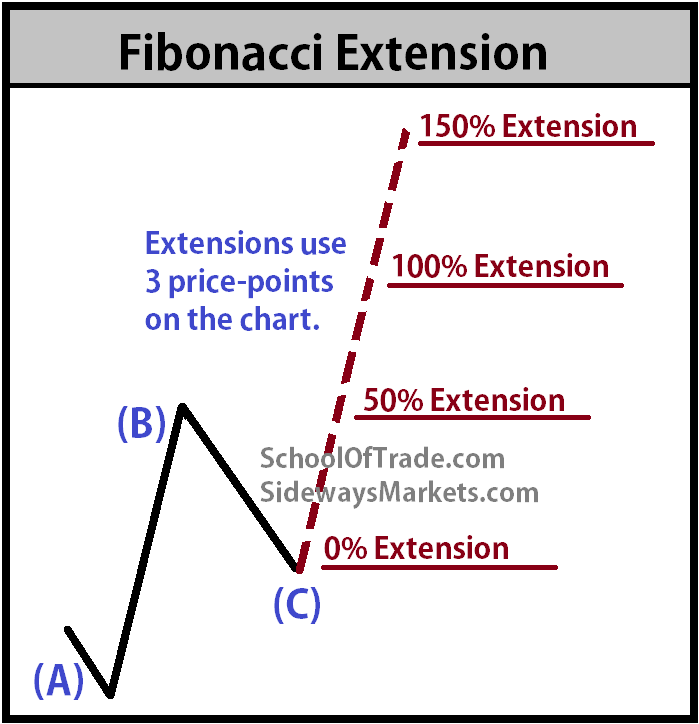
Fibonacci Extension:
A Fibonacci Extension is a measurement using 3 points on a chart, and is the most commonly-used technique for defining profit-targets among day traders.
We will use 3 price-points on the chart, calling them ‘A’, ‘B’, and ‘C’.
The Fibonacci extension is going to measure the range from points ‘A’ to ‘B’ and then extend that range from the deepest point of the retracement at point ‘C’
The theory behind a Fibonacci extension is that if price went from ‘A’ to ‘B’ previously, it will likely move the same amount of range in the future.
BONUS: In addition to measuring the range of PRICE from points ‘A’ to ‘B’ and then projection that price range into the future, we can also measure the TIME it took to move from points ‘A’ to ‘B’ and then extend that TIME into the future from point ‘C’.
This is called a Fibonacci TIME Extension, and is a very popular tool for trade-management.
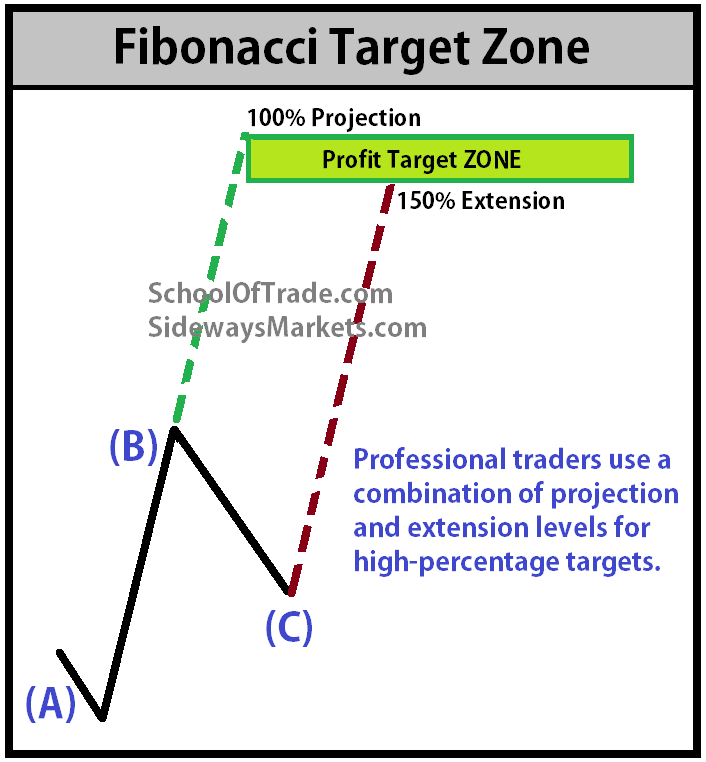
Fibonacci Target ZONE:
Professional traders use Fibonacci retracements, projections and extensions in many different ways, but the most powerful way is to combine the Fibonacci projections and extensions into a ‘range’ that can be used as a profit-target on your trade.
Combine the Fibonacci projections and extensions into a profit-target ZONE to manage the trade like a professional.
===========================================================
Want to see us trade LIVE? Click here to register for the Free Trial!
Automated Trading Strategy; Let the Computer do the trading
Are you a Crude Oil Trader? Click here to trade Crude Oil
Are you a Euro Trader? Click here to trade Euro
Are you an E-Mini Russell Trader? Click here to trade E-Mini Russell
Are you a Gold Trader? Click here to trade Gold
Join the Premier Live trade-room as an Advanced Member