September 13, 2012
- in Uncategorized by schooloftrade
Morning Mini-Russell Checklist:

Heat Map
Review:
Heat map
confirms this market personality is bearish at a -0.4%
confirms this market personality is bearish at a -0.4%
Overnight
Highs & Lows:
Highs & Lows:
 We can see
this is a range-bound market with the buyers failing, and then later this
morning the sellers failing. This creates
a short term trading range, and we want to buy the lows and sell the highs.
Inside or
Outside Day?
Outside Day?
we are Inside the range from Wednesday just below the PHOD.
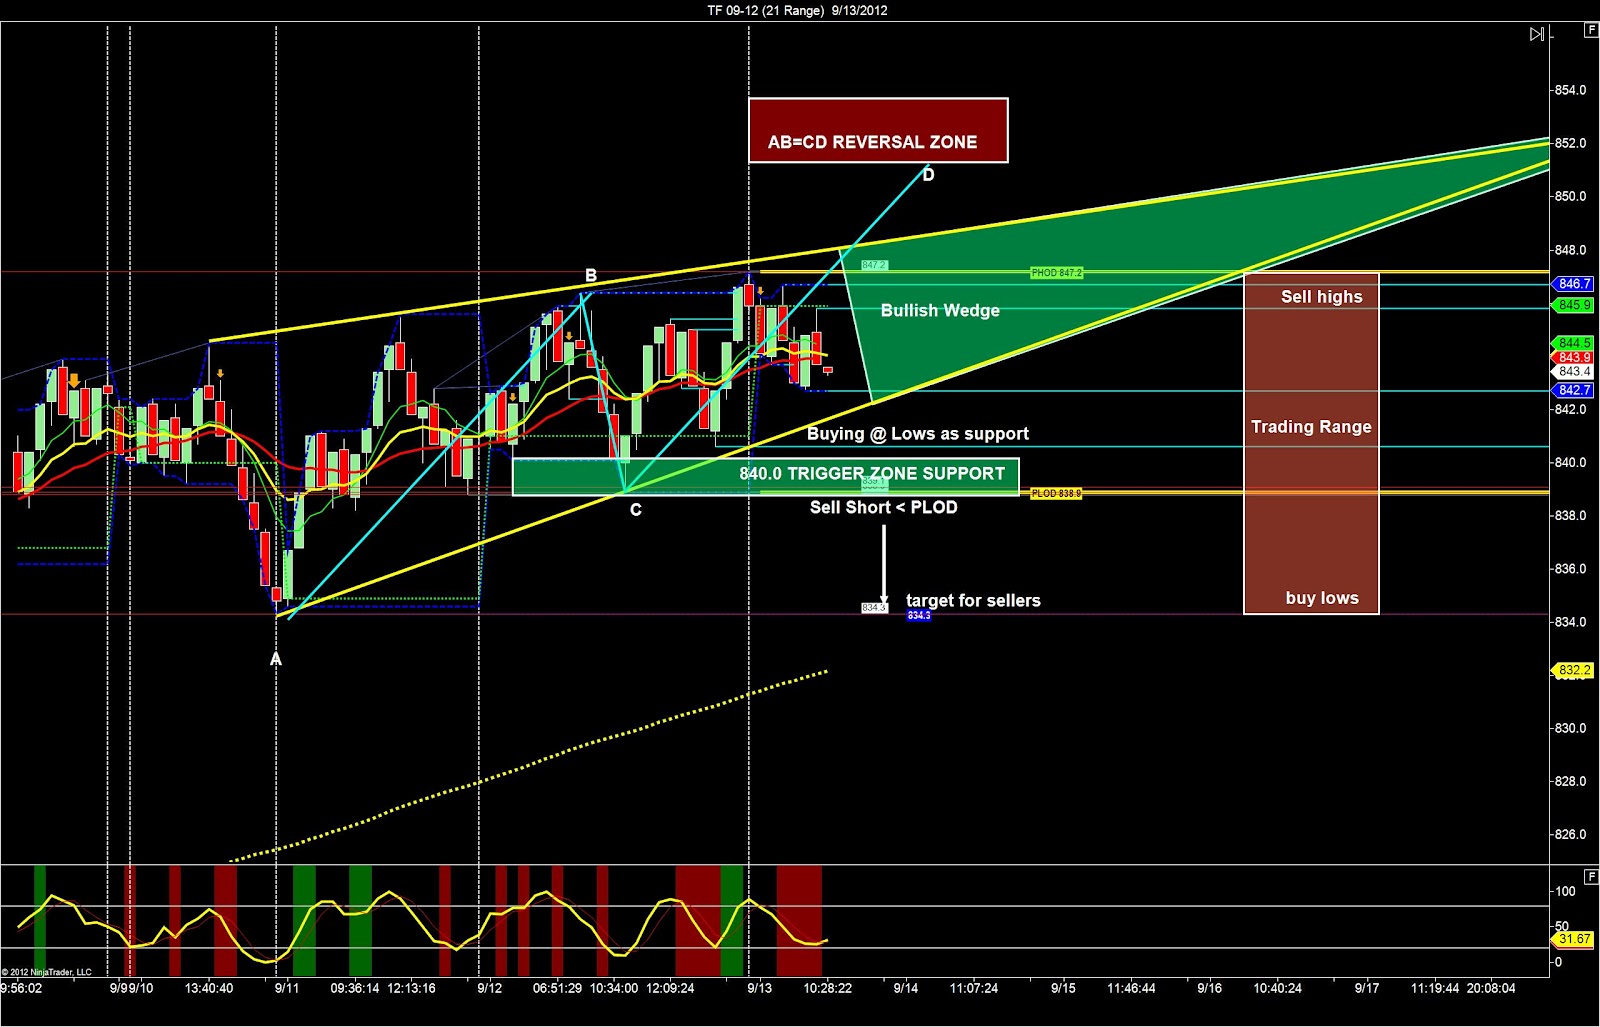 Find the price-structures:
 · Trigger-zone is support below us
· AB=CD Pattern is bearish and we are
trading at resistance as we speak.
trading at resistance as we speak.
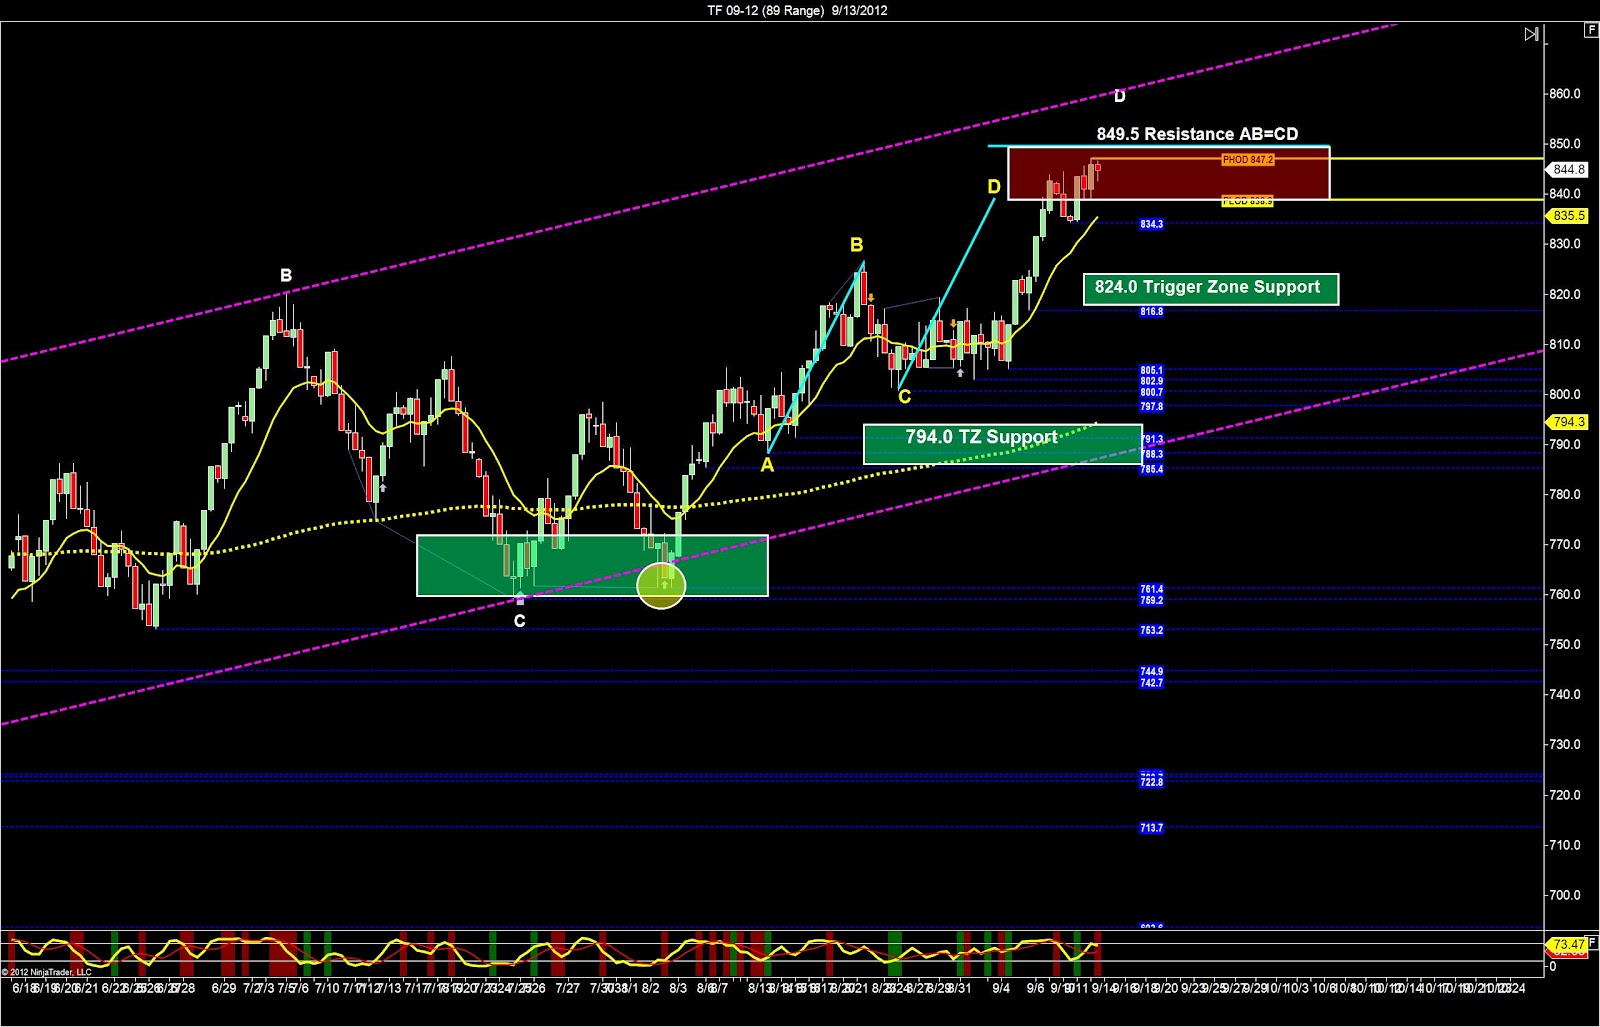
· Price-channel is bullish with resistance
860.0 at the highs.
860.0 at the highs.
Where
will a reversal be likely today?
will a reversal be likely today?
The price-reversal
is most likely at the PHOD and the 849.5 AB=CD Pattern resistance level. If price goes through the 849.5 we will look
for the fake-out-breakout and then buy with a wave-pattern-long
is most likely at the PHOD and the 849.5 AB=CD Pattern resistance level. If price goes through the 849.5 we will look
for the fake-out-breakout and then buy with a wave-pattern-long
 What is
our trading plan for today?
We are going to sell the resistance at PHOD and the AB=CD
Pattern highs 849.5. If price goes
through the 849.5 we will look for the fake-out-breakout and then buy with a wave-pattern-long
with a profit-target around 860.0 the price-channel highs. If price falls I’m going to buy the lows of
the bullish price-wedge (21range) and then with new lower-lows and the sellers
CLEARLY in control I will sell short below price-wedge lows with a profit-target
at PLOD, the 834.4 support, and if price keeps falling I will continue to sell
using wave-pattern-short down to 824.0 trigger-zone support for an easy target.