August 17, 2012
- in Uncategorized by schooloftrade
Morning dollar index Checklist:

Heat
Map: What is it telling us?
Map: What is it telling us?
The dollar
index is not moving very much, at 0.1% we don’t have the confidence to use the correlation,
and we will keep checking back to see if this market personality improves.
index is not moving very much, at 0.1% we don’t have the confidence to use the correlation,
and we will keep checking back to see if this market personality improves.
OHLC
Analysis:
Analysis:
We are
lacking direction this morning with 2 higher-highs and 2 lower-lows.
lacking direction this morning with 2 higher-highs and 2 lower-lows.
Overnight
Highs & Lows:
Highs & Lows:
We have the
buyers failing above the overnight highs, and this is bearish on the dollar index. This tells me to be bullish on the markets we
trade.
buyers failing above the overnight highs, and this is bearish on the dollar index. This tells me to be bullish on the markets we
trade.
Are we
inside or outside day today?
inside or outside day today?
We are
trading above the PLOD, in the lower third of the range, but this is considered
an INSIDE
DAY.
trading above the PLOD, in the lower third of the range, but this is considered
an INSIDE
DAY.
What
price-structures do we see?
price-structures do we see?
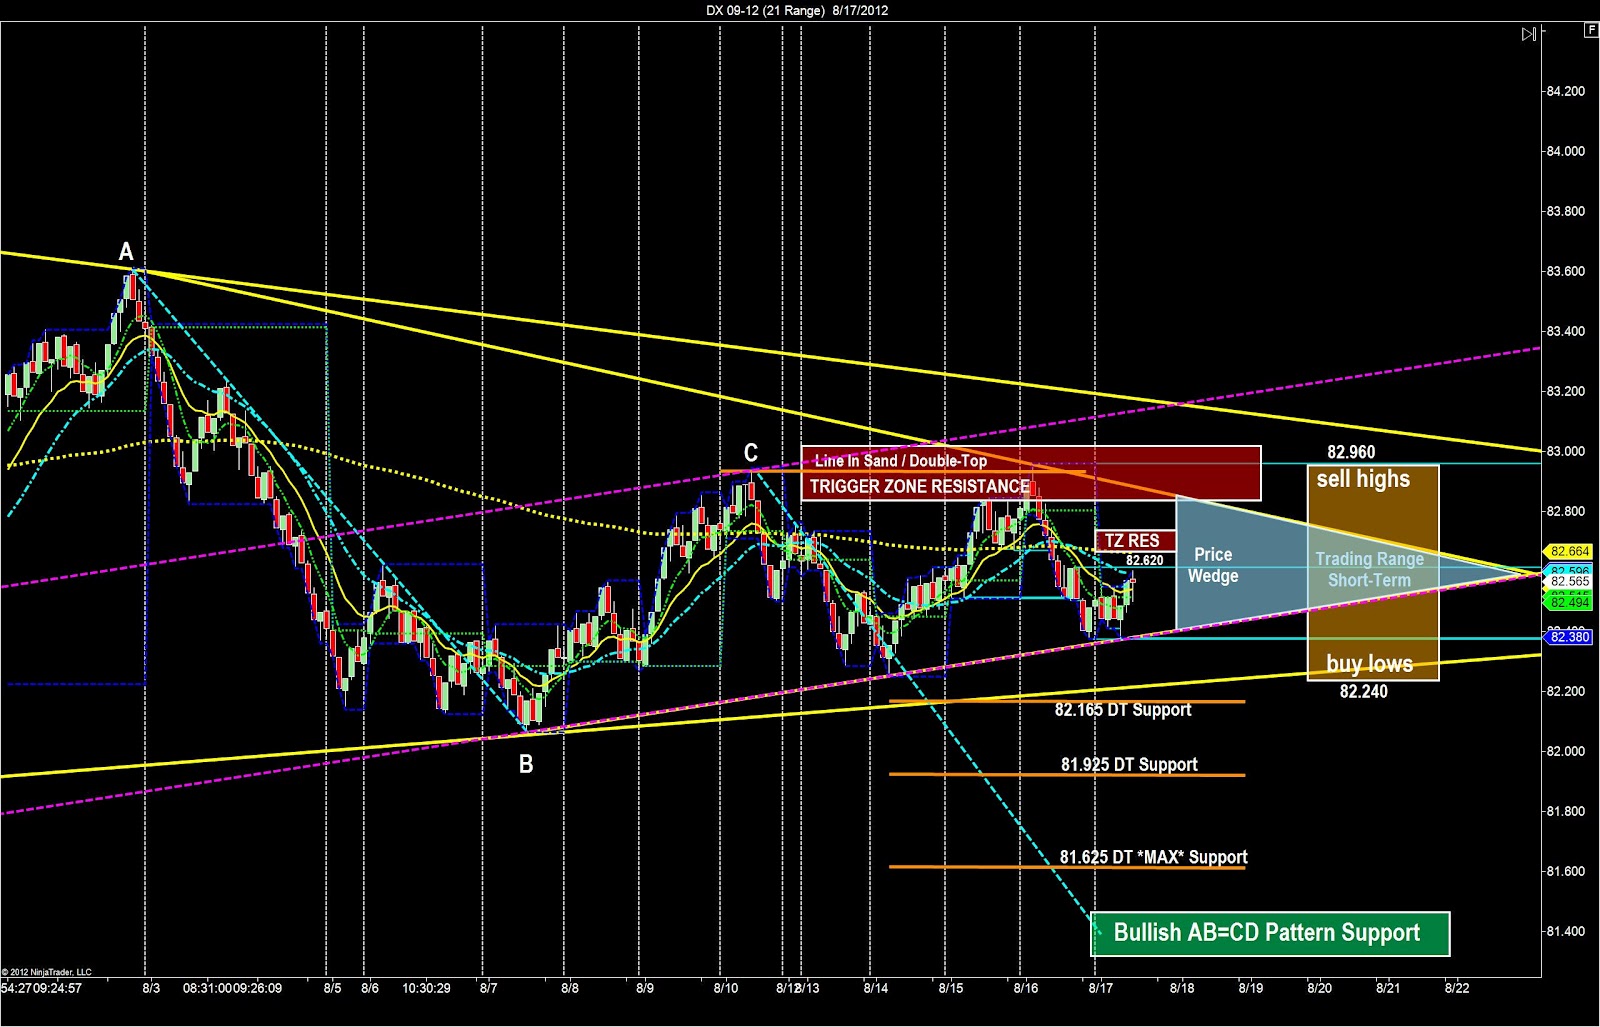
· Trigger-zone is resistance overhead
from top to bottom.
from top to bottom.
· AB=CD Pattern is bullish and really
not in play for us today.
not in play for us today.
· Price wedge is the most important clue,
this is a bull price wedge because of the bull price channel we see already.
this is a bull price wedge because of the bull price channel we see already.
· Trading Ranges from 82.960 down to 82.240
and we are in the middle of this range.
and we are in the middle of this range.
· Double-top provides us with resistance
and multiple levels of support which we will use if they come into play today.
and multiple levels of support which we will use if they come into play today.
Where
will a reversal be likely today?
will a reversal be likely today?
We have a swing-high
above 82.620 and a break of that high will likely push prices up to the trigger-zone
above it. If price falls a more
high-percentage price-reversal will occur at the price wedge lows around
82.380.
above 82.620 and a break of that high will likely push prices up to the trigger-zone
above it. If price falls a more
high-percentage price-reversal will occur at the price wedge lows around
82.380.
What is
our trading plan for today?
our trading plan for today?
We think the dollar index is bearish after the
OHLC analysis, so we expect a falling dollar index. This means we’re buying Crude Oil, E-Mini-Russell,
euro, gold futures. When the dollar
index finally hits the price wedge lows we then assume a price-reversal will
occur, and at that time we will see all the highs start to fail and we can then
SELL THE HIGHS on markets we traded long earlier in the morning.