August 16, 2012
- in Uncategorized by schooloftrade
Morning dollar index Checklist:

Heat
Map: What is it telling us?
Heat map
says the dollar index is flat, and almost at 0.0% this means we need to be patient today,
its going to be a little waiting game for the market personality this morning.
says the dollar index is flat, and almost at 0.0% this means we need to be patient today,
its going to be a little waiting game for the market personality this morning.
OHLC
Analysis:
Analysis:
We have 4
out of 4 higher-highs on the OHLC this is assumed to be bullish at first
glance.
out of 4 higher-highs on the OHLC this is assumed to be bullish at first
glance.
Overnight
Highs & Lows:
Highs & Lows:
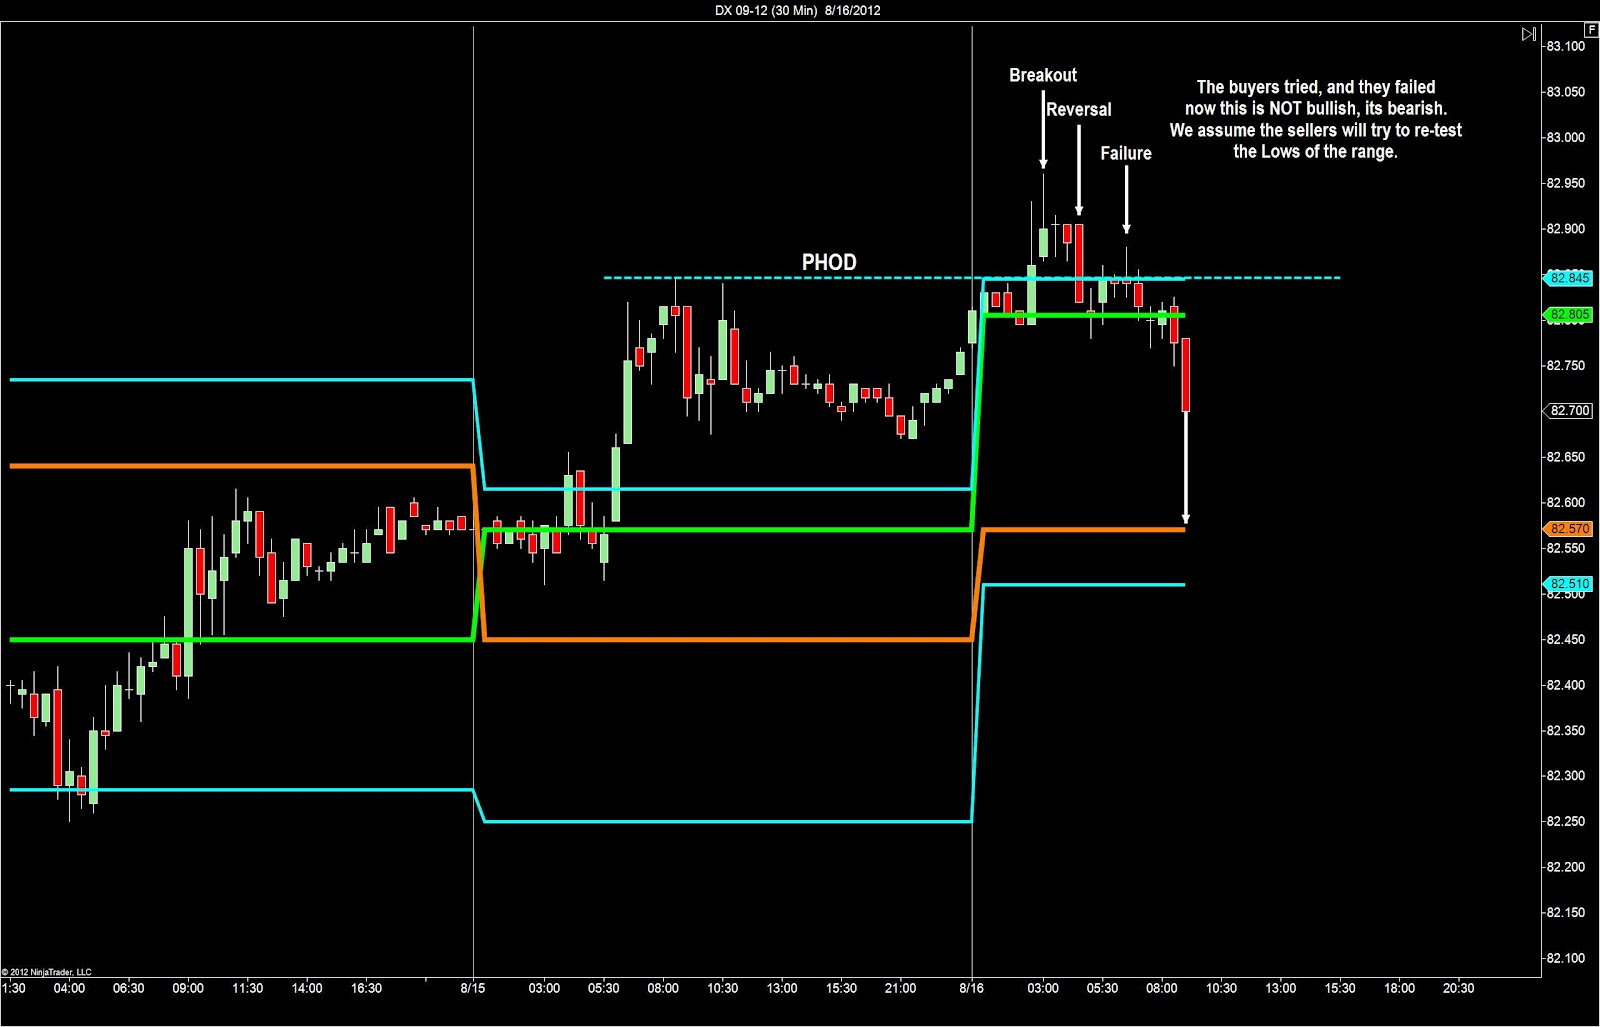
The buyers
tried and failed to push new higher-highs above the PHOD, so this is not only
an inside
day price structure but its also very bearish.
tried and failed to push new higher-highs above the PHOD, so this is not only
an inside
day price structure but its also very bearish.
 What
Whatprice-structures do we see?
· Trigger-zone is support below us at
82.600, which will also be a profit target for the markets we trade most.
82.600, which will also be a profit target for the markets we trade most.
· AB=CD Pattern is bullish and ALMOST
broke at the ‘C’ point. The fact that
sellers were strong enough to hold price below the ‘line in sand’ is a very
bearish clue.
broke at the ‘C’ point. The fact that
sellers were strong enough to hold price below the ‘line in sand’ is a very
bearish clue.
· Price wedge we have two of them, the
current and the previous.
current and the previous.
· Price channel is bullish, which makes
the high-percentage trades buying at the lows.
the high-percentage trades buying at the lows.
· Trading Ranges from 82.960 down to
82.250
82.250
· Double-top is easy to spot on this
21range chart and we now have major support waiting for us below the price
wedge.
21range chart and we now have major support waiting for us below the price
wedge.
Where
will a reversal be likely today?
will a reversal be likely today?
We have already
seen the price-reversal off the range highs and the ‘C’ point on the dollar
index.
seen the price-reversal off the range highs and the ‘C’ point on the dollar
index.
What is
our trading plan for today?
our trading plan for today?
Our OHLC analysis tells us the dollar index should
be bearish this morning. A bearish dollar
index will mean bullish markets if the market personality on the dollar index can
improve. Our plan today is to stay
patience as we do not see a lot of volatility or interests in these markets at
800am EST.