September 25, 2012
- in Uncategorized by schooloftrade
Morning Crude Oil Checklist:

Heat Map
Review:
Crude Oil is
bullish and on the move at a +1.4% on our heat map.
bullish and on the move at a +1.4% on our heat map.
Overnight
Highs & Lows:
Highs & Lows:
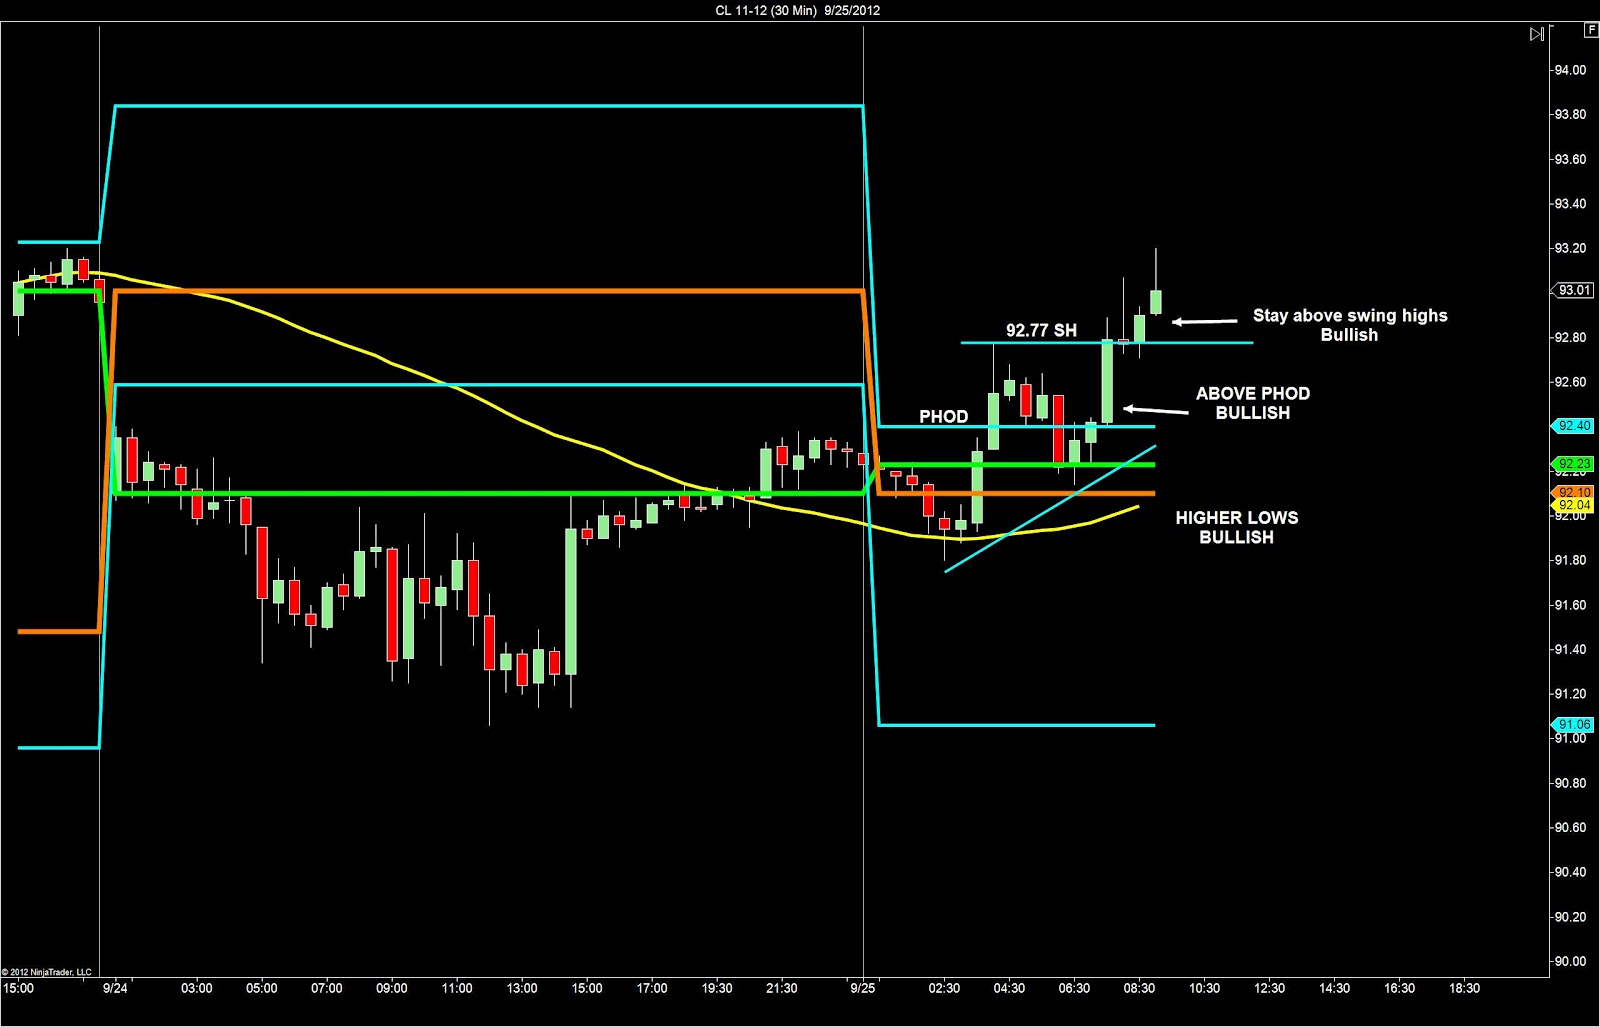
We are
bullish market personality this morning on Crude Oil with the higher-lows
overnight, and a bullish candlestick pushing through the PHOD, followed by the
buyers making new higher-highs above the PHOD.
bullish market personality this morning on Crude Oil with the higher-lows
overnight, and a bullish candlestick pushing through the PHOD, followed by the
buyers making new higher-highs above the PHOD.
Inside or
Outside Day?
Outside Day?
Above the PHOD,
and even more important, we broke new higher-highs above the PHOD, this is
considered bullish as the buyers in the marketplace see price as being too
CHEAP.
and even more important, we broke new higher-highs above the PHOD, this is
considered bullish as the buyers in the marketplace see price as being too
CHEAP.
 Find the price-structures:
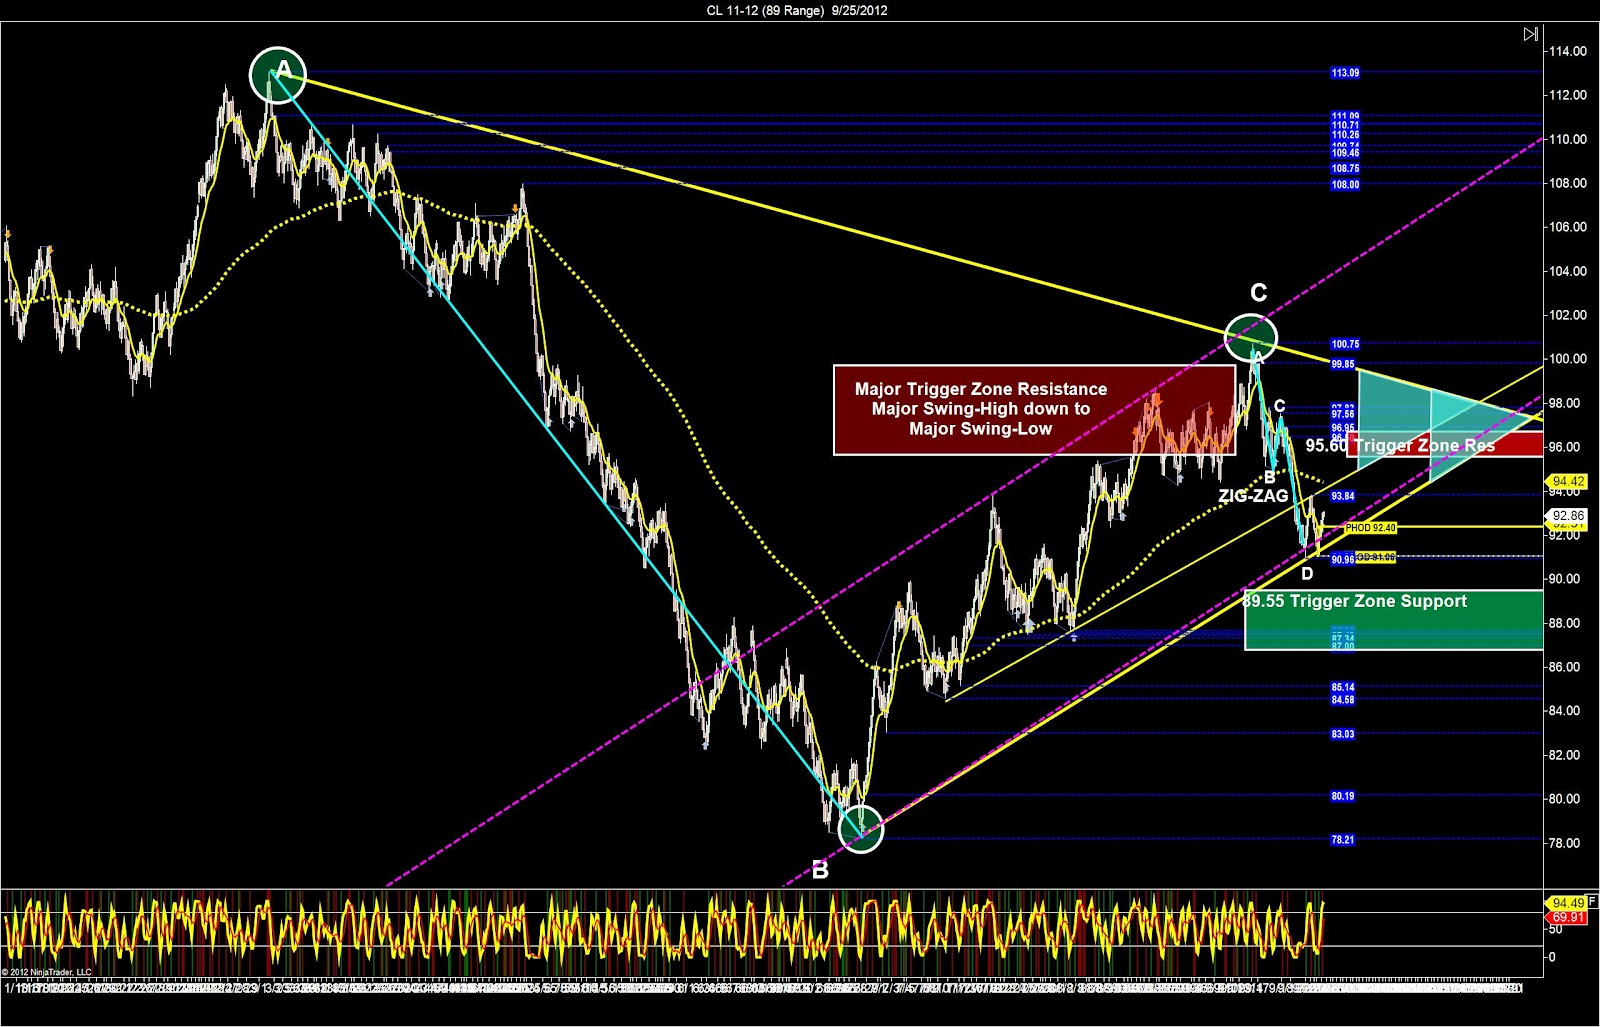
 · Trigger-zone is support below at
89.55, resistance above at 95.60
89.55, resistance above at 95.60
· AB=CD Pattern is bullish, and also
considered a zig-zag (advanced price-structure)
considered a zig-zag (advanced price-structure)
· Price-wedge is there and we have two
of them, both are bullish because of the bullish price-channel.
of them, both are bullish because of the bullish price-channel.
· Price-channel is bullish and we are
bullish trying to buy at its lows (support)
bullish trying to buy at its lows (support)
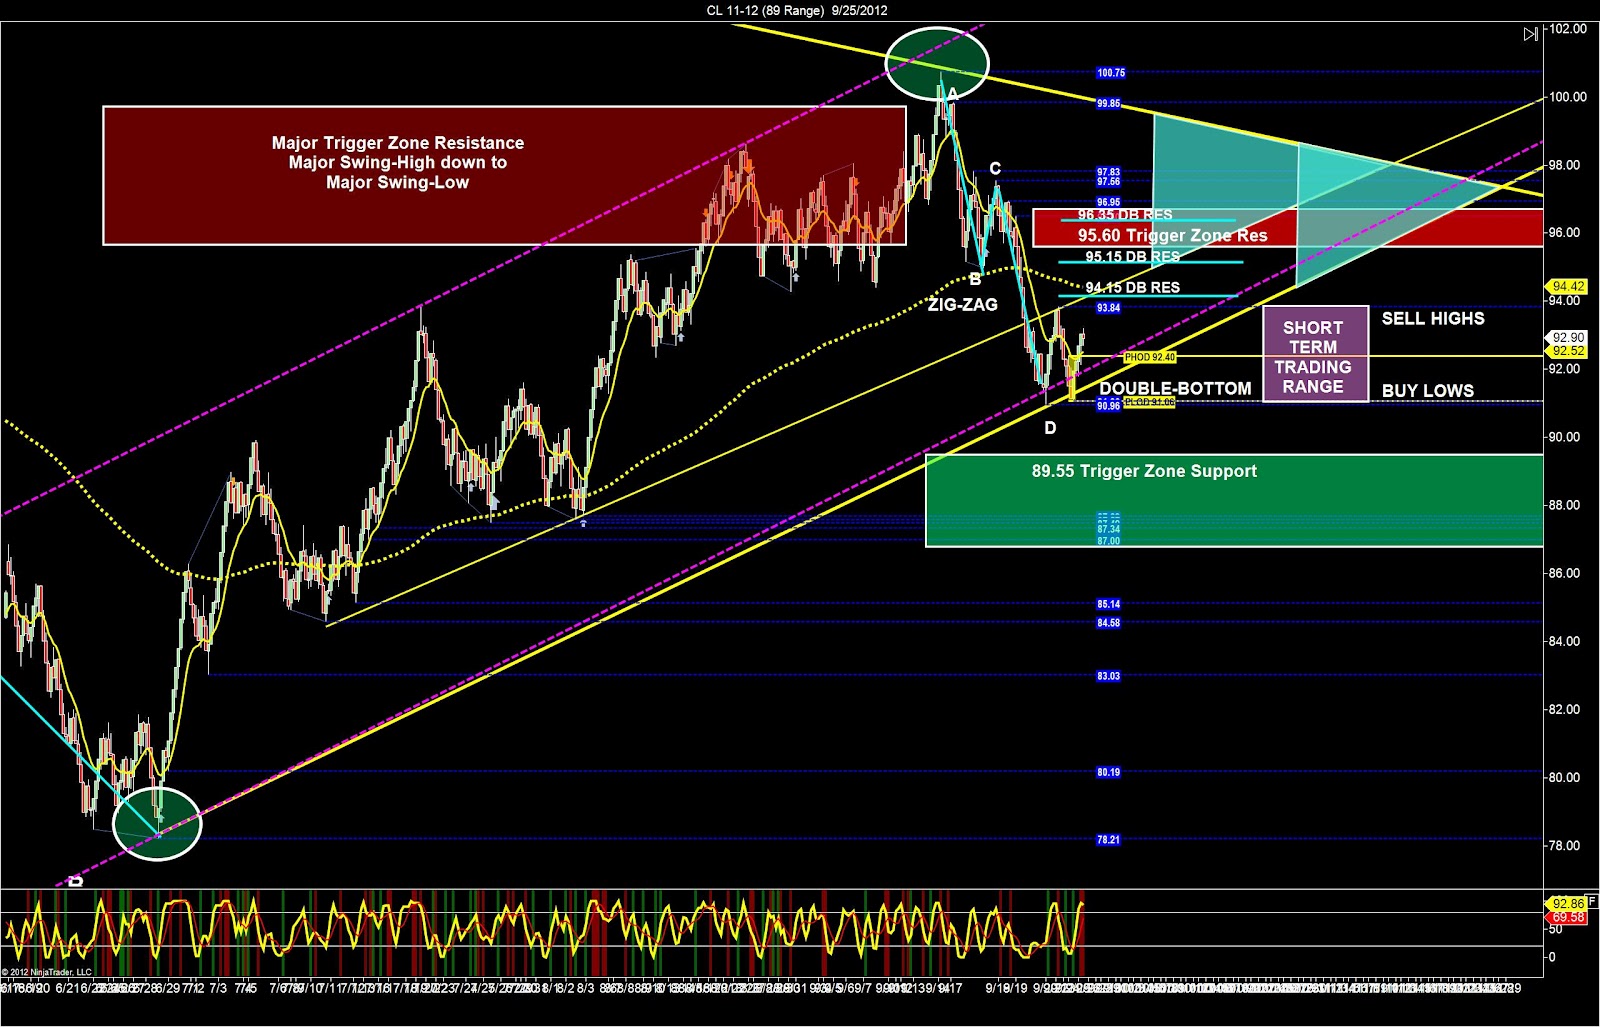
· Short Term Trading Range from 93.84
(we want to sell) down to 90.96 (where we want to buy)
(we want to sell) down to 90.96 (where we want to buy)
· Double-bottom provides us with
overhead resistance starting at 94.15
overhead resistance starting at 94.15
 Where
Wherewill a reversal be likely today?
We are
trading at the lows of the major bull price-channel, so we want to buy these
lows looking for the price-reversal as the sellers run into major support. 94.15, the resistance from the double-bottom is
also a spot to look for the price-reversal we always love to use the double-bottom
and double-top levels for these.
What is
our trading plan for today?
our trading plan for today?
Our plan for today is to remain patient and wait for the market
personality to tell us when the best times of the morning will occur. We need higher-highs or lower-lows with lots
of speed to confirm this market personality.
personality to tell us when the best times of the morning will occur. We need higher-highs or lower-lows with lots
of speed to confirm this market personality.
We want to stay looking for buying opportunities above the PHOD
and since we’re at the price-channel lows this makes even more sense to look
for buying opportunities as price rises.
and since we’re at the price-channel lows this makes even more sense to look
for buying opportunities as price rises.
With that said, these buyers on Crude Oil may fail eventually
this morning, and when they do we want to sell the failure with a profit-target
at the PHOD.
this morning, and when they do we want to sell the failure with a profit-target
at the PHOD.
If we see a 21-Wave Pattern fail we will be looking for the price-reversal
and a re-test of the PHOD at 92.40.
then, if price can get below the PHOD we then have a target short down
at the PLOD at 91.06
and a re-test of the PHOD at 92.40.
then, if price can get below the PHOD we then have a target short down
at the PLOD at 91.06