August 23, 2012
- in Uncategorized by schooloftrade
Morning Crude Oil Checklist:

Heat
Map: What is it telling us?
Map: What is it telling us?
Heat map
says bullish and the chart with market personality says bearish.
says bullish and the chart with market personality says bearish.
Overnight
Highs & Lows:
Highs & Lows:
We broke
above the PHOD and the buyers failed, which was then followed by a strong
bearish push lower, then made even more bearish with the higher jobless claims
news at 830am est.
above the PHOD and the buyers failed, which was then followed by a strong
bearish push lower, then made even more bearish with the higher jobless claims
news at 830am est.
Are we
inside or outside day today?
inside or outside day today?
We are
inside the range from Wednesday, which means we want to sell when the PHOD holds
as resistance. We also know the high-percentage-trades
are to hold short to the lows of the range.
inside the range from Wednesday, which means we want to sell when the PHOD holds
as resistance. We also know the high-percentage-trades
are to hold short to the lows of the range.
What
price-structures do we see?
price-structures do we see?
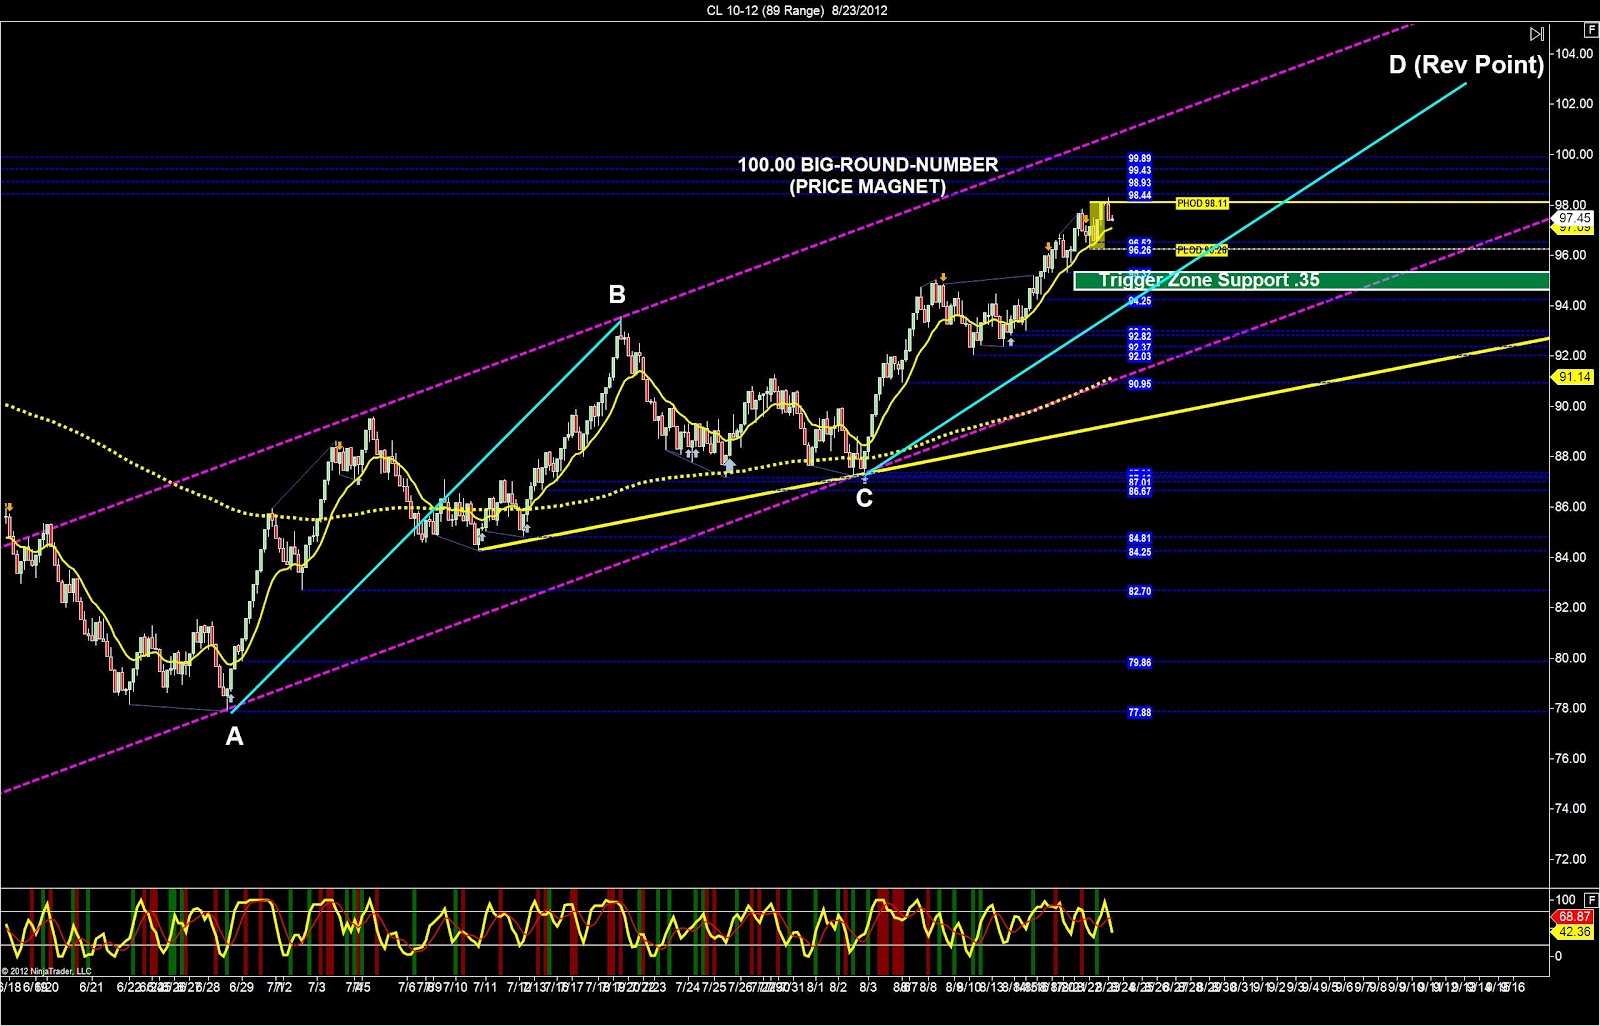
· Trigger-zone is support below us
starting at .35
starting at .35
· AB=CD Pattern is bearish and its
really not in play at this time.
really not in play at this time.
· Price-wedge is not on this chart
· Price-channel is bullish which means
the wave patterns on the 21-range long are the high-percentage-trades
the wave patterns on the 21-range long are the high-percentage-trades
Where
will a reversal be likely today?
will a reversal be likely today?
If we can
test the PLOD or the lows of the range we will likely see these buyers come
back into the market and keep plugging away up to the 100 big-round-number.
test the PLOD or the lows of the range we will likely see these buyers come
back into the market and keep plugging away up to the 100 big-round-number.
What is
our trading plan for today?
our trading plan for today?
We’re
waiting for market personality to confirm short trades since we saw the buyers
fail at the highs. This market
personality is a little sluggish at 900am est so we’re staying patient on the
trade. We want to use wave pattern short
to and final profit at 97.00 for this sell off.
If the price tests the 97.00 lows we will then look to buy these lows as
support. If the price keeps dropping we
will then sell with wave short.