August 21, 2012
- in Uncategorized by schooloftrade
Morning Crude Oil Checklist:

 |
| CRUDE OIL CHART PREP |
Heat
Map: What is it telling us?
Map: What is it telling us?
Heat Map
says a bullish 1.3% and this makes sense considering the positive market
sentiment in Europe and the dollar index collapse this morning.
says a bullish 1.3% and this makes sense considering the positive market
sentiment in Europe and the dollar index collapse this morning.
OHLC
Analysis:
Analysis:
We see the
buyers took control at the PHOD as the sellers could not reverse off the highs.
buyers took control at the PHOD as the sellers could not reverse off the highs.
Overnight
Highs & Lows:
Highs & Lows:
We have
broken new higher-highs and this market sentiment is very clearly bullish.
broken new higher-highs and this market sentiment is very clearly bullish.
Are we
inside or outside day today?
inside or outside day today?
We are WAY
outside day, above the PHOD we are using the wave-pattern-long to execute with
our plan.
outside day, above the PHOD we are using the wave-pattern-long to execute with
our plan.
What
price-structures do we see?
price-structures do we see?
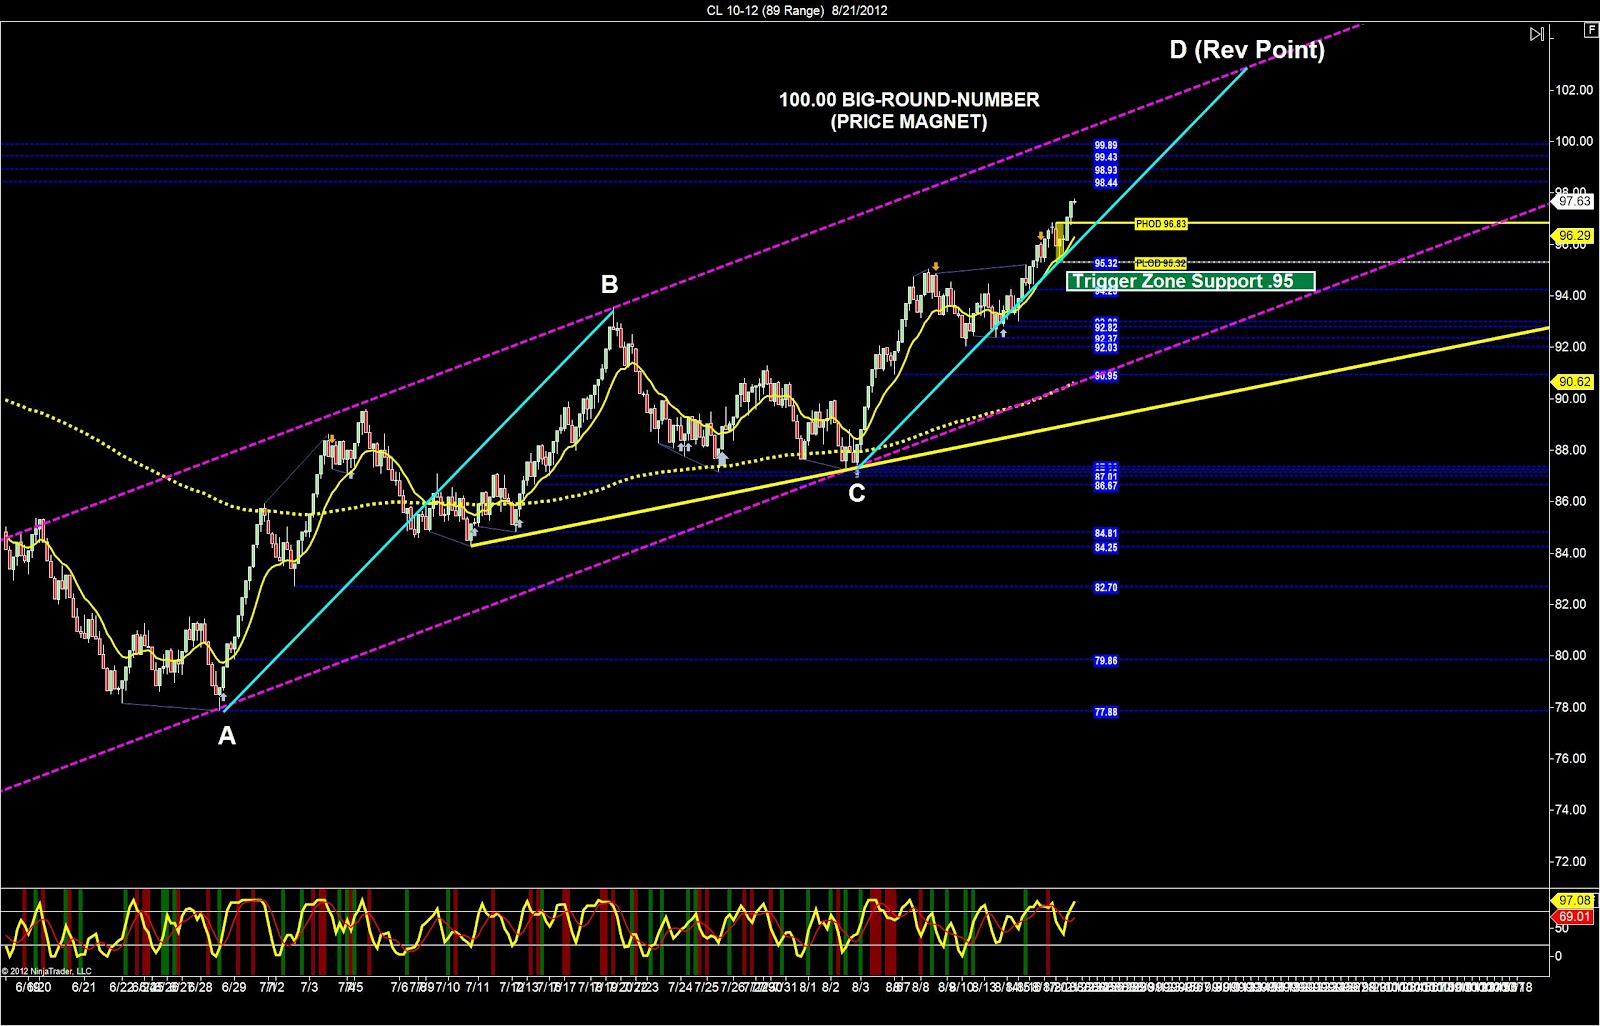
· Trigger-zone is support below us at
94.95
94.95
· AB=CD Pattern is bearish and it lines
up perfectly with the top of the bull channel.
up perfectly with the top of the bull channel.
· Wedge is not on this chart
· Channel is bullish and gives us an
easy target for the buyers today.
easy target for the buyers today.
Where
will a reversal be likely today?
will a reversal be likely today?
If price
keeps rising, we assume a potential reversal will occur at the major resistance
of 98.44. If price cannot keep rising we
will see the reversal below 96.83 which is the PHOD.
keeps rising, we assume a potential reversal will occur at the major resistance
of 98.44. If price cannot keep rising we
will see the reversal below 96.83 which is the PHOD.
What is
our trading plan for today?
our trading plan for today?
if the DX
pushes lower we are buying with wave-pattern long. Our targets will be at the resistance
overhead.
pushes lower we are buying with wave-pattern long. Our targets will be at the resistance
overhead.