August 16, 2012
- in Uncategorized by schooloftrade
Morning Crude Oil Checklist:

 |
| CRUDE OIL OHLC ANALYSIS |
Heat
Map: What is it telling us?
Heat map
says +0.4% which goes right along with the bearish dollar index and tells us
this market will continue to move higher.
says +0.4% which goes right along with the bearish dollar index and tells us
this market will continue to move higher.
OHLC
Analysis:
Analysis:
We are 4 for
4 higher-highs so we assume we are bullish.
4 higher-highs so we assume we are bullish.
Overnight
Highs & Lows:
Highs & Lows:
This bullish
market sentiment is confirmed with the new lower-lows in price which later gave
us a higher-low and then a strong bullish candle above the open. We assume the PHOD is on our radar for the
next level to test overhead.
market sentiment is confirmed with the new lower-lows in price which later gave
us a higher-low and then a strong bullish candle above the open. We assume the PHOD is on our radar for the
next level to test overhead.
Are we
inside or outside day today?
inside or outside day today?
We are
trading inside the range from Wednesday, and we can see the sellers tested the PLOD
and then that support held. This is very
bullish.
trading inside the range from Wednesday, and we can see the sellers tested the PLOD
and then that support held. This is very
bullish.
 |
| CRUDE OIL 89-RANGE |
What
price-structures do we see?
price-structures do we see?
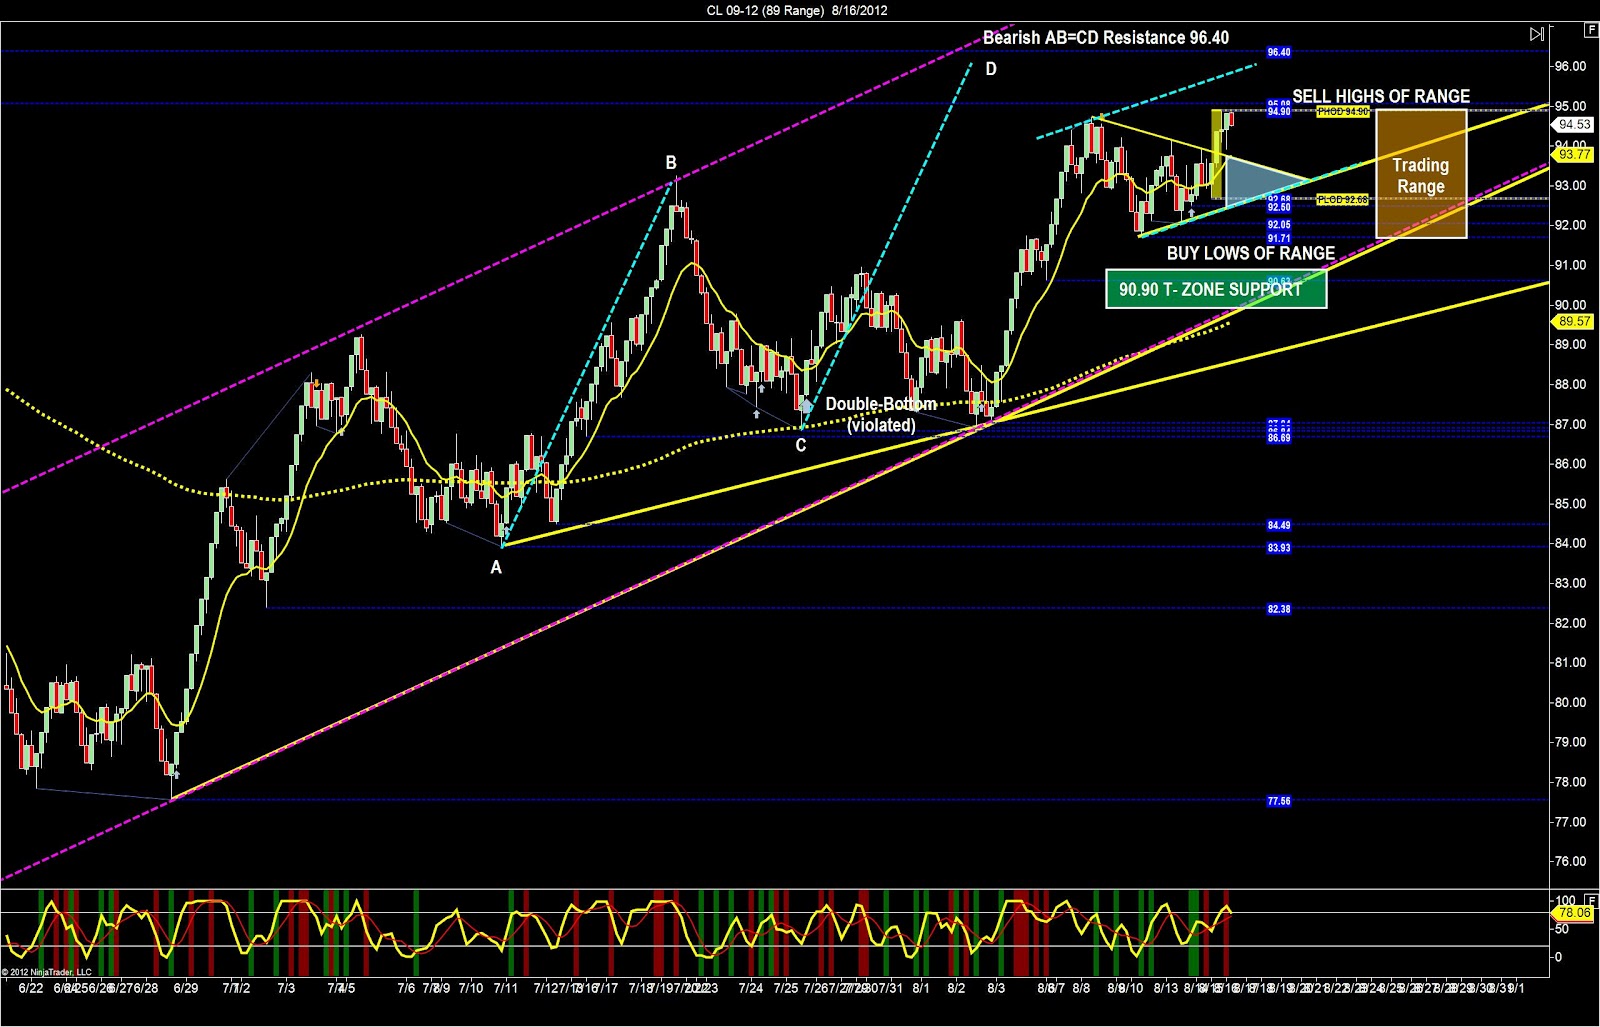
· Trigger-zone is support below us
· AB=CD Pattern is bearish and within
our reach today at 96.40
our reach today at 96.40
· Price wedge is bullish inside a
potential bullish price channel. We also
have the bigger picture bullish price channel which we are in the middle.
potential bullish price channel. We also
have the bigger picture bullish price channel which we are in the middle.
· Trading Ranges from 94.90 down to
91.71
91.71
· Double-bottom is there, but we have
recently broken the resistance.
recently broken the resistance.
Where
will a reversal be likely today?
will a reversal be likely today?
We have
already seen a price-reversal at the PLOD early-early morning here in the
US. The next price-reversal will occur
at the PHOD or if price keeps rising it will likely reverse at the new short
term bull price channel highs (dotted blue line)
already seen a price-reversal at the PLOD early-early morning here in the
US. The next price-reversal will occur
at the PHOD or if price keeps rising it will likely reverse at the new short
term bull price channel highs (dotted blue line)
What is
our trading plan for today?
our trading plan for today?
A bearish dollar index, and a bullish analysis
on Crude Oil tells us to keep buying using the wave-pattern-long with profit
target at the PHOD and the highs of the range.
Once we get to these highs we need to look to sell at resistance and if
price keeps pushing higher we then use wave-pattern-long to buy above 95.08
with the profit target at the price channel highs overhead around 96.00. If price reverses this close to the PHOD and
we see strong sellers we know this market sentiment is changing and we can
assume sellers will try to drag price back down into the price wedge (blue triangle)
below us around 93.75.