September 14, 2012
- in Uncategorized by schooloftrade
Morning Crude Oil Checklist:

Heat Map
Review:
The heat map
says 1.5% volatility, which means this is a moving market (anything greater
than or equal to 0.3%) so we will look for trading opportunities now.
says 1.5% volatility, which means this is a moving market (anything greater
than or equal to 0.3%) so we will look for trading opportunities now.
Overnight
Highs & Lows:
Highs & Lows:
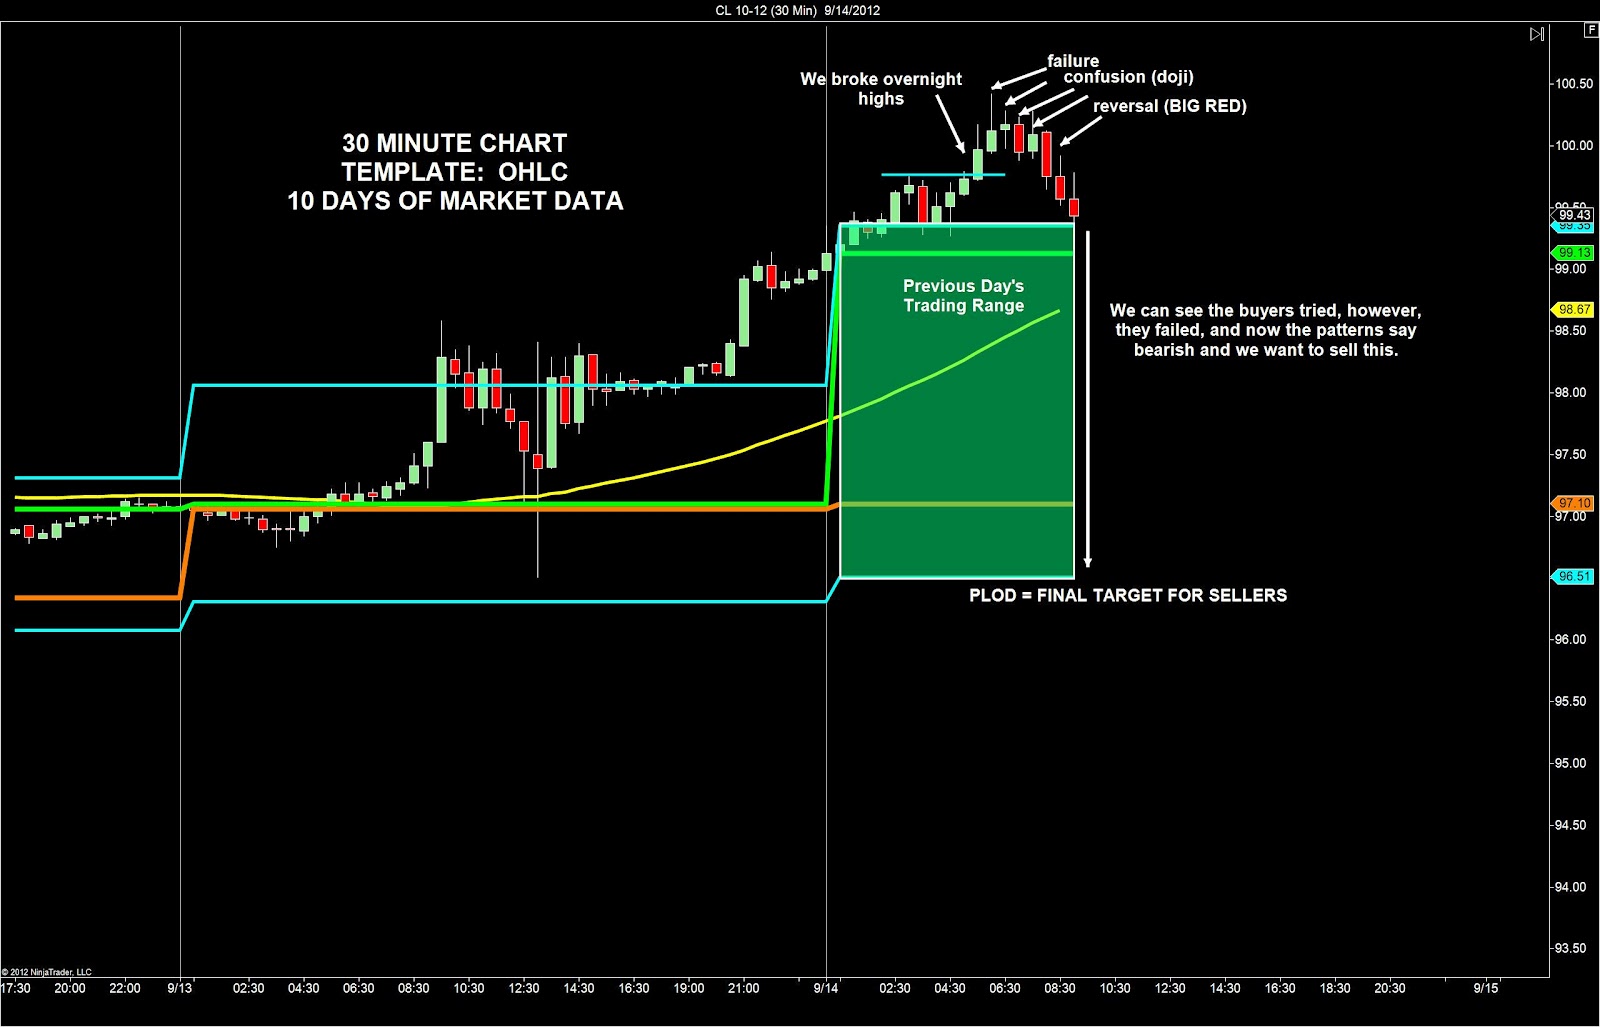
We can see
the buyers tried, however, they failed,
and now the patterns say bearish and
we want to sell this.
the buyers tried, however, they failed,
and now the patterns say bearish and
we want to sell this.
Inside or
Outside Day?
Outside Day?
We are
outside day, for now, but we’re just about to tumble below the PHOD which means
this is an outside day failure. This is
VERY bearish, and we want to sell below the PHOD.
outside day, for now, but we’re just about to tumble below the PHOD which means
this is an outside day failure. This is
VERY bearish, and we want to sell below the PHOD.
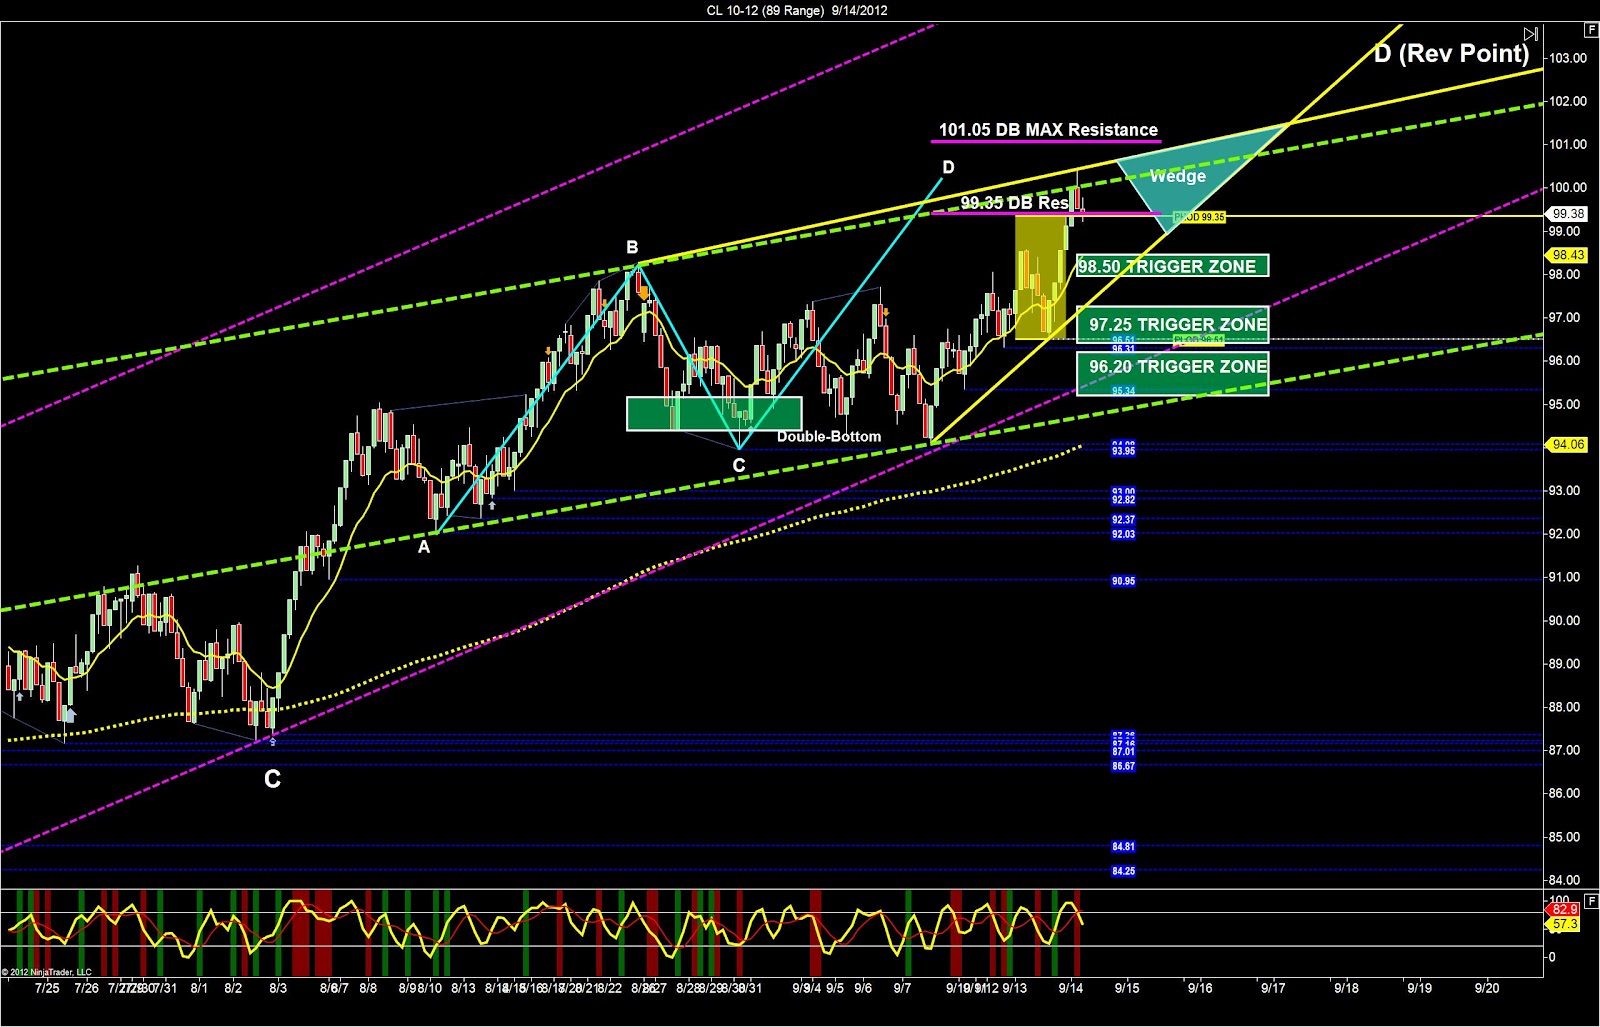 Find the price-structures:
 · Trigger-zone is support below us
starting at 98.50
starting at 98.50
· AB=CD Pattern is bearish
· Wedge is very bullish
· Price-channel is bullish and we are
at the highs, which is major resistance.
at the highs, which is major resistance.
· Double-bottom resistance is at 99.35
and 101.05 we will look for selling opportunities at this resistance.
and 101.05 we will look for selling opportunities at this resistance.
 Where
Wherewill a reversal be likely today?
We are
likely to see the price-reversal at the price-channel highs, the double-bottom resistance,
and at the PHOD. We want to sell these
highs looking for the buyers to fail.
likely to see the price-reversal at the price-channel highs, the double-bottom resistance,
and at the PHOD. We want to sell these
highs looking for the buyers to fail.
What is
our trading plan for today?
our trading plan for today?
Our plan is to stay patient for the best ‘windows of
opportunity’ which on a Friday may come and go quickly. We are at the highs of the range, and with
the news from FOMC overnight we assume these buyers will eventually run out of ‘gas’
and this price will fall off the highs.
We want to use the PHOD and the LOD as profit-target and the 98.50 as a
runner target