September 4, 2012
- in Uncategorized by schooloftrade
Morning Crude Oil Checklist:

 Heat
HeatMap: What is it telling us?
The heat map
says the Dollar-Index is flat and the rest of the markets are waiting for market
personality to give us some direction today.
says the Dollar-Index is flat and the rest of the markets are waiting for market
personality to give us some direction today.
Overnight
Highs & Lows:
Highs & Lows:
We failed at
the highs from Monday, and we see a strong bearish (red) candlestick pushing
off the highs. This tells us this market
is bearish.
the highs from Monday, and we see a strong bearish (red) candlestick pushing
off the highs. This tells us this market
is bearish.
Are we
inside or outside day today?
inside or outside day today?
Inside day
below the PHOD and the buyers just failed.
below the PHOD and the buyers just failed.
What
price-structures do we see?
price-structures do we see?
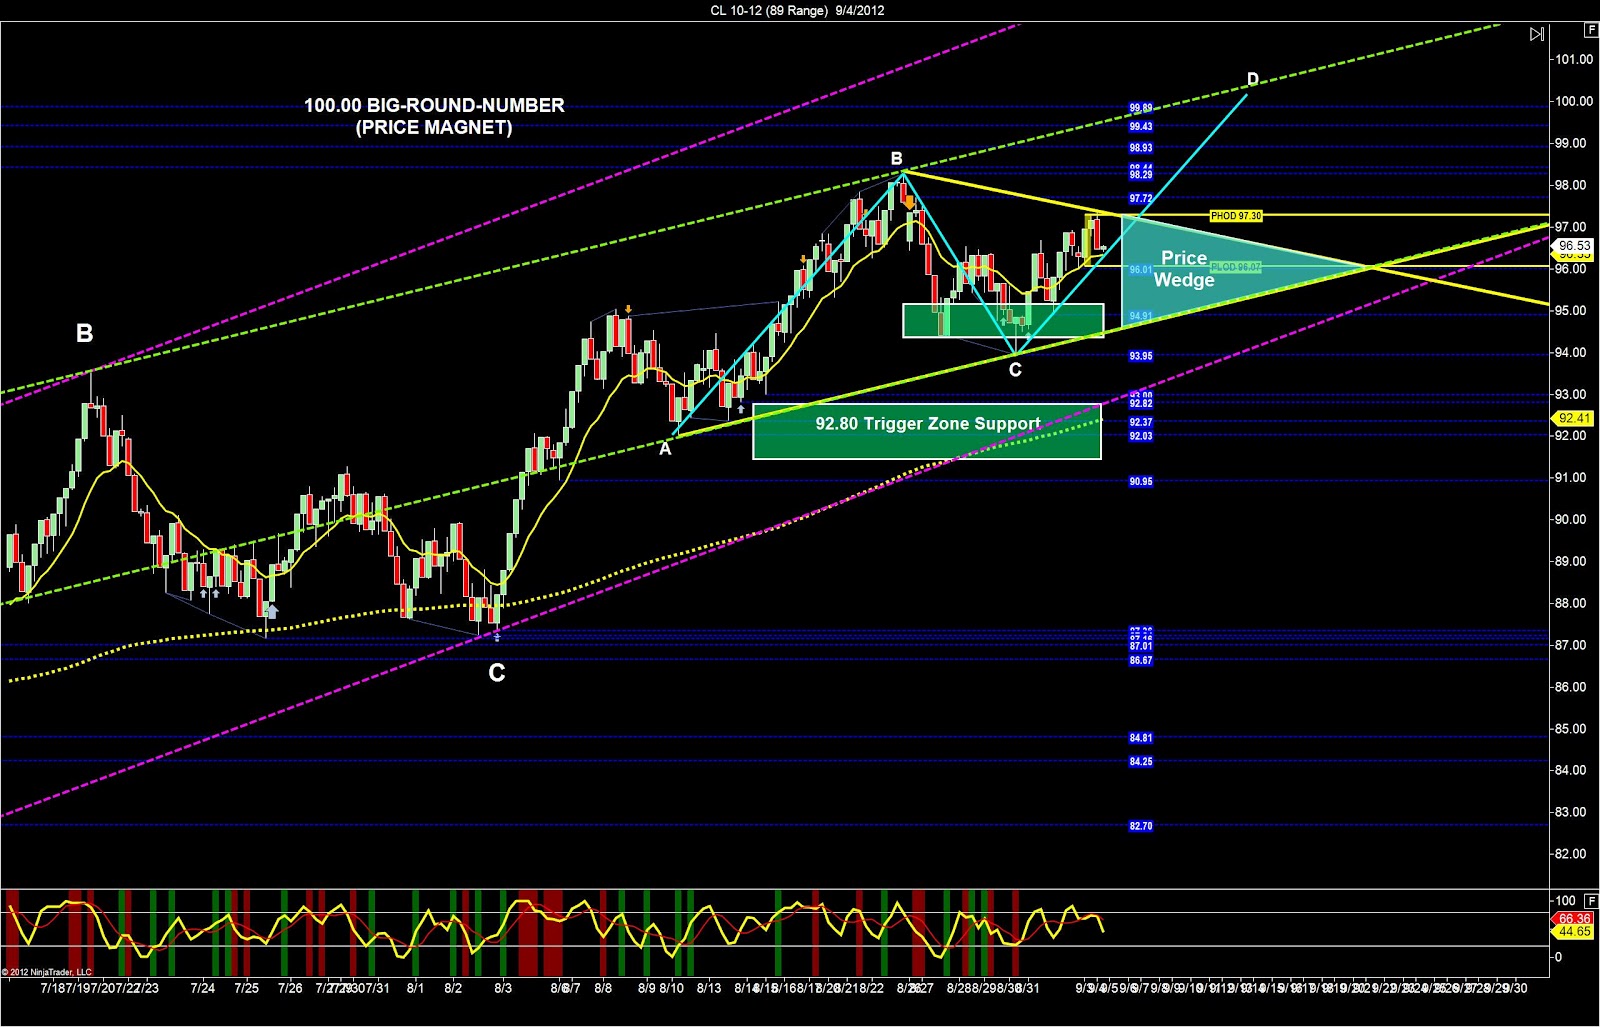
· Trigger-zone is support below us
around 95.00.
around 95.00.
· AB=CD Pattern is bearish, giving us a
selling location at 100.00 big-round-number.
selling location at 100.00 big-round-number.
· Price-wedge is bullish, inside a bull
price-channel.
price-channel.
Where
will a reversal be likely today?
will a reversal be likely today?
If price
moves higher we will assume the price-reversal will occur at the price-wedge highs. If price falls lower the price-reversal will
likely occur at the PLOD. Furthermore, if
price makes it all the way to the price-wedge lows we will see a price-reversal
bouncing off the price-wedge lows.
moves higher we will assume the price-reversal will occur at the price-wedge highs. If price falls lower the price-reversal will
likely occur at the PLOD. Furthermore, if
price makes it all the way to the price-wedge lows we will see a price-reversal
bouncing off the price-wedge lows.
What is
our trading plan for today?
our trading plan for today?
We are
selling short using wave-pattern-short and breaker pattern to use the buyers
failure at the PHOD and take profit at the PLOD. We know there is a price-wedge so we want to sell-the-high
at resistance and buy-the-lows at support of the price-wedge.
selling short using wave-pattern-short and breaker pattern to use the buyers
failure at the PHOD and take profit at the PLOD. We know there is a price-wedge so we want to sell-the-high
at resistance and buy-the-lows at support of the price-wedge.