July 29, 2013
- in Uncategorized by schooloftrade
Mini-Russell day trading strategy

Mini-Russell 240-minute:
 |
| Mini-Russell 240-Minute |
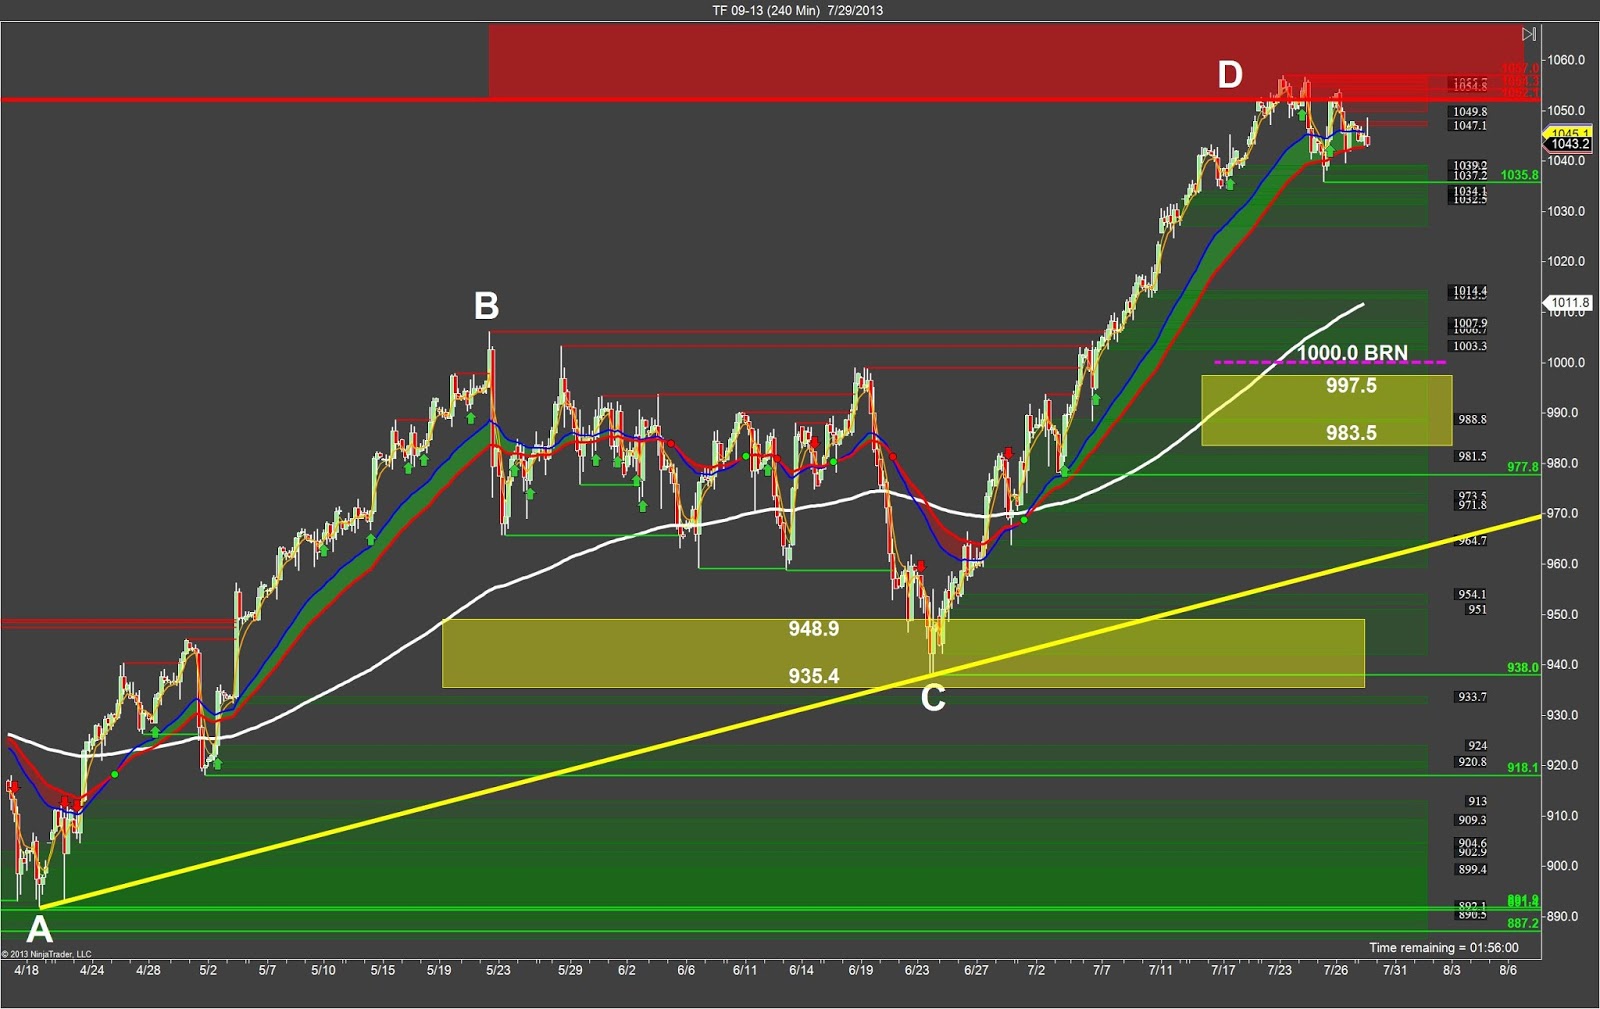
We can see
the massive move higher and the completion of the AB=CD Pattern which gives us major
resistance at the 1050.0 price level overhead.
We can assume that unless there buyers are VERY strong we are going to
see the sellers take control and push this price-action lower.
the massive move higher and the completion of the AB=CD Pattern which gives us major
resistance at the 1050.0 price level overhead.
We can assume that unless there buyers are VERY strong we are going to
see the sellers take control and push this price-action lower.
Mini-Russell 60-minute:
 |
| Mini-Russell 60-minute |
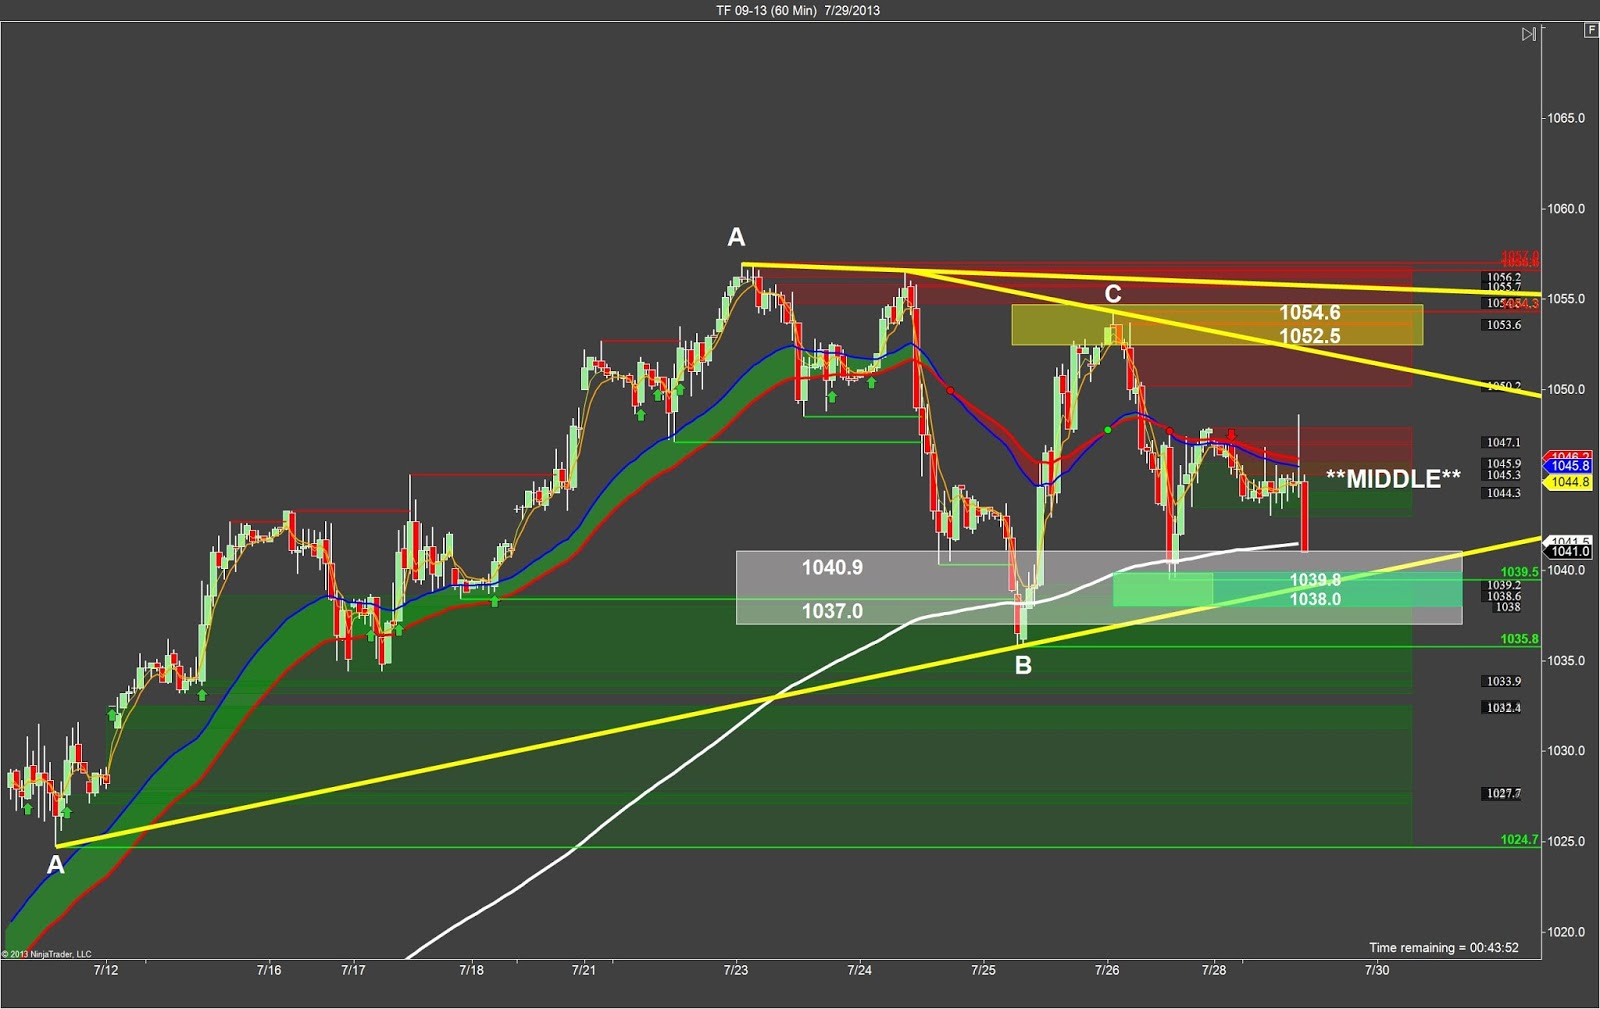
The most
important clue we see on the hourly anchor chart is the price-wedge telling us
to buy-the-lows at support and sell-the-high at resistance using the trigger-zones
at 1039.8 and 1052.5 to buy and sell at support and resistance.
important clue we see on the hourly anchor chart is the price-wedge telling us
to buy-the-lows at support and sell-the-high at resistance using the trigger-zones
at 1039.8 and 1052.5 to buy and sell at support and resistance.
Mini-Russell Entry Timeframe:
 |
| Mini-Russell 5-Minute |
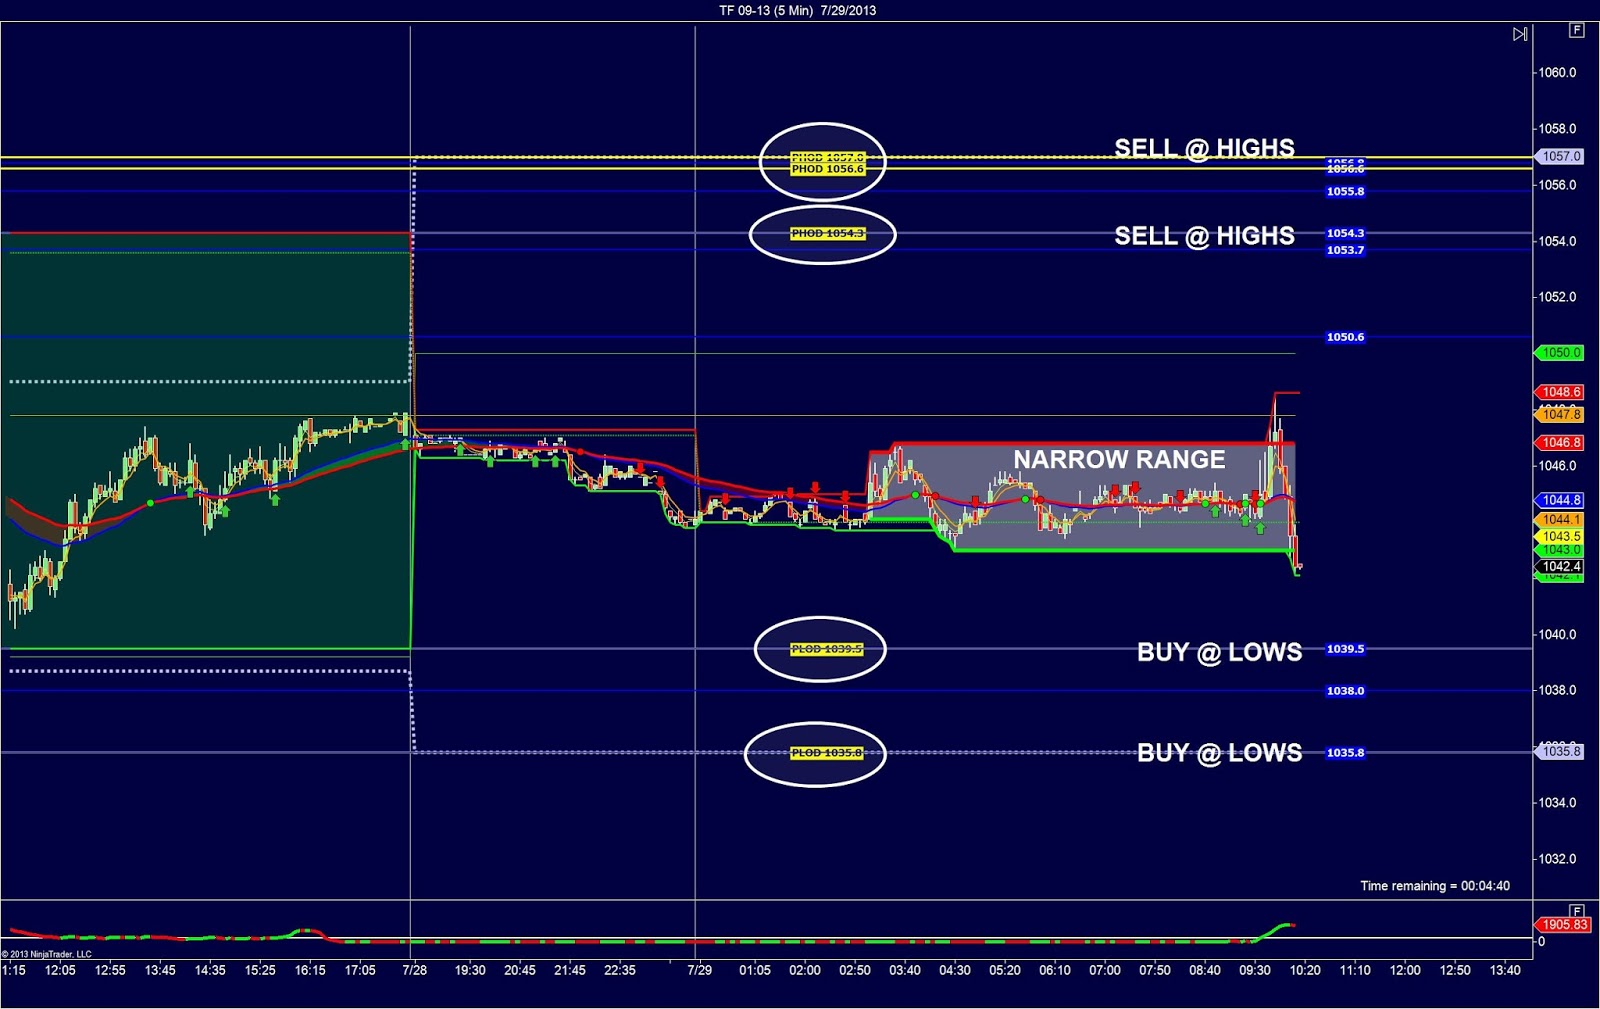
The 5-minute
chart shows us that the Mini-Russell is trading inside the range from last Friday,
and we can see the weekly highs from last week just above last Friday’s highs
at 1057.0 and the prior week’s lows down at 1035.8.
chart shows us that the Mini-Russell is trading inside the range from last Friday,
and we can see the weekly highs from last week just above last Friday’s highs
at 1057.0 and the prior week’s lows down at 1035.8.
We can see
the weekly range HIGHS and LOWS, which is not very common. This narrow trading-range
over the last week tells us to look for fake-out-breakouts at the highs and the
lows, and to trade with a simple strategy of buying the lows and selling the highs.
the weekly range HIGHS and LOWS, which is not very common. This narrow trading-range
over the last week tells us to look for fake-out-breakouts at the highs and the
lows, and to trade with a simple strategy of buying the lows and selling the highs.