February 26, 2013
- in Uncategorized by schooloftrade
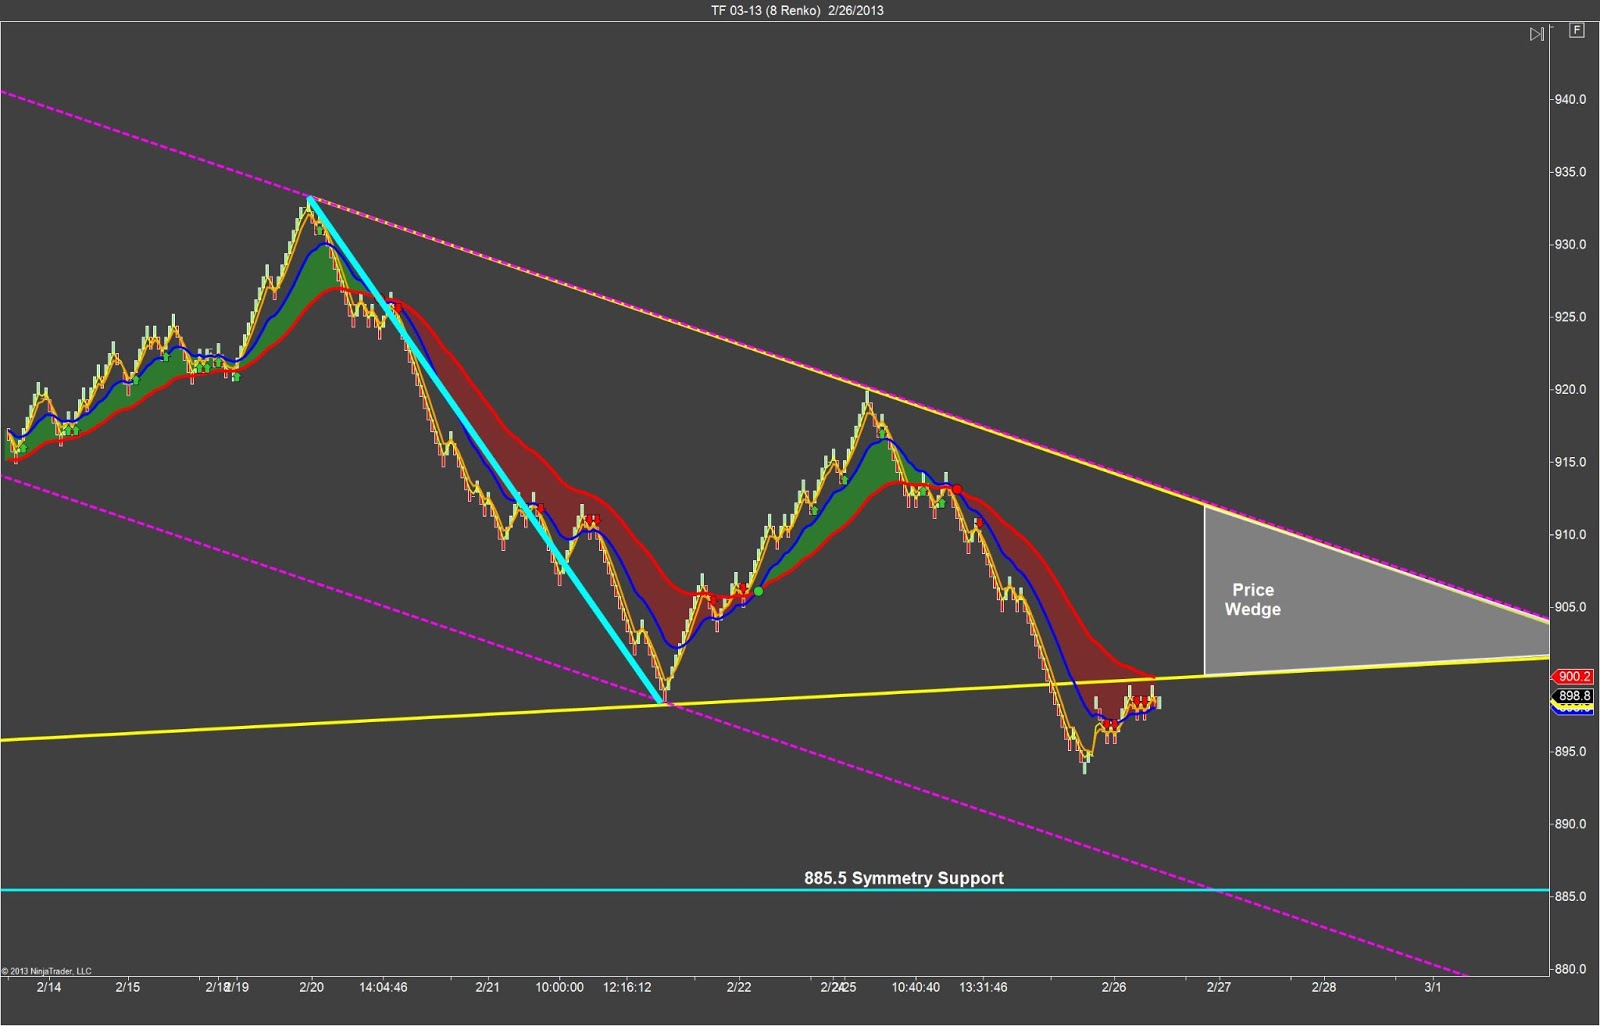
Mini-Russell Anchor Chart Prep

 |
| Mini-Russell Anchor Chart Prep |
We can see
the Mini-Russell futures are trading just below the price-wedge lows on our
anchor chart, which is giving us a clue that we need to anticipate a bearish price-channel
along with the symmetry support.
the Mini-Russell futures are trading just below the price-wedge lows on our
anchor chart, which is giving us a clue that we need to anticipate a bearish price-channel
along with the symmetry support.
Our entry
chart on the Mini-Russell shows us that we have 3 potential scenarios to
consider. First, if price moves higher
we will use a buy-signal to enter long effectively buying the lows of the price-wedge
from the anchor chart, and take profit-target at the highs of the price-wedge. Second, if price moves lower and keeps moving
lower below the PLOD we will use the Wave Set-Up to enter short. Third, if price trades sideways we will sit-on-hands
at the lows of the range.
The most
exciting opportunity this morning will come if the sellers fail after making
new lower-lows. If we can get a fake-out-breakout
below the PLOD we will not only be able to use the InsideOut Set-up to get
long, but we also have the price-magnet from the price-wedge that will drag
this price-action back up to the highs of the price-wedge around 911.5
resistance.
 |
| Mini-Russell Entry Chart Prep |
Another big
clue from the entry chart is the bearish price-channel that we can see clearly
is almost ready to fail. This looks like
a fish swimming up-stream, and as soon as the sellers give up and let the
buyers take control we will likely see new higher-highs and then we will use a
buy signal to enter long which is also the lows of the price-wedge which makes
this a very high-percentage-trade. Take your
profit-target at the highs of the price-wedge, and if you like to use a runner,
the PHOD at 920.3 is your profit-target.