February 3, 2014
- in Uncategorized by schooloftrade
Manufacturing hits record lows; Equities Tumble, Gold jumps | Newsletter 02/03/14; SchoolOfTrade.com

“You must know that in any moment a decision you
make can change the course of your life forever: the very next person you stand
behind in line or sit next to on an airplane, the very next phone call you make
or receive, the very next movie you see or book you read or page you turn could
be the one single thing that causes the floodgates to open, and all of the
things that you’ve been waiting for to fall into place.”
Reflections from Today:
·
Demand
for Equities continues to tumble as the Fed reduces stimulus and economic
growth is slowing down
Demand
for Equities continues to tumble as the Fed reduces stimulus and economic
growth is slowing down
·
Chinese
Manufacturing hits 6-months lows overnight
Chinese
Manufacturing hits 6-months lows overnight
·
ISM Manufacturing comes
out weaker than expected; sharpest drop in history for ‘new orders’ (blamed it
on the snow?)
ISM Manufacturing comes
out weaker than expected; sharpest drop in history for ‘new orders’ (blamed it
on the snow?)
·
Crude
Oil went lower (-.75% @ 96.67)
Crude
Oil went lower (-.75% @ 96.67)
·
Gold
went higher (+.90% @ 1256.3)
Gold
went higher (+.90% @ 1256.3)
·
Mini-Russell
went lower (-3.20% @ 1092.0)
Mini-Russell
went lower (-3.20% @ 1092.0)
·
Feb
3rd 1913 was the beginning of Federal
Income Tax, over-turning the 16th Amendment which had forbid income
tax in the US. Tea anyone?
Feb
3rd 1913 was the beginning of Federal
Income Tax, over-turning the 16th Amendment which had forbid income
tax in the US. Tea anyone?
·
Ben
Bernanke hits the road, headed to Brookings Institute, well-known Think-Tank
Ben
Bernanke hits the road, headed to Brookings Institute, well-known Think-Tank
·
Janet
Yellen was sworn in today as the new chair of the Federal Reserve Bank of
the US, the largest bank in the world.
Janet
Yellen was sworn in today as the new chair of the Federal Reserve Bank of
the US, the largest bank in the world.
·
Chinese
New Year continues into Friday of this week
Chinese
New Year continues into Friday of this week
·
Ford
Earnings reported -7% y/y, GM reports a loss of 12% y/y, blame it on the snow!
Ford
Earnings reported -7% y/y, GM reports a loss of 12% y/y, blame it on the snow!
·
Tomorrow,
December Factory Orders
in the middle of the morning
Tomorrow,
December Factory Orders
in the middle of the morning
Economic News for Tomorrow:
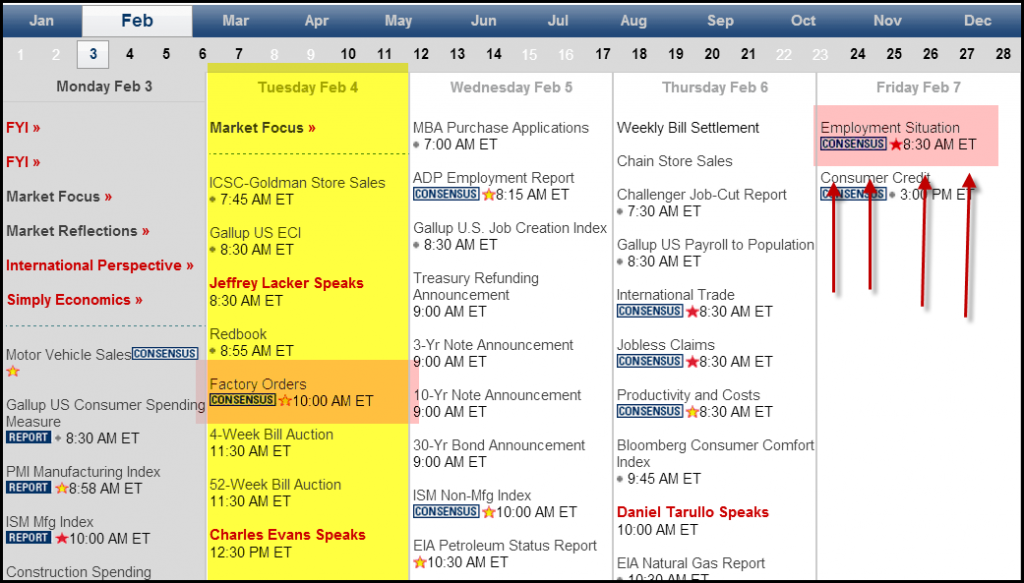
Tomorrow morning
we continue with more news from Manufacturing in the US. Today’s disappointing report from ISM leaves
us looking for more information in tomorrow’s Factory Orders Report, which is
also expected to show a decline of 1.8%.
we continue with more news from Manufacturing in the US. Today’s disappointing report from ISM leaves
us looking for more information in tomorrow’s Factory Orders Report, which is
also expected to show a decline of 1.8%.
10:00am EST: Factory
Orders
Orders
Day trading plan for Tomorrow:
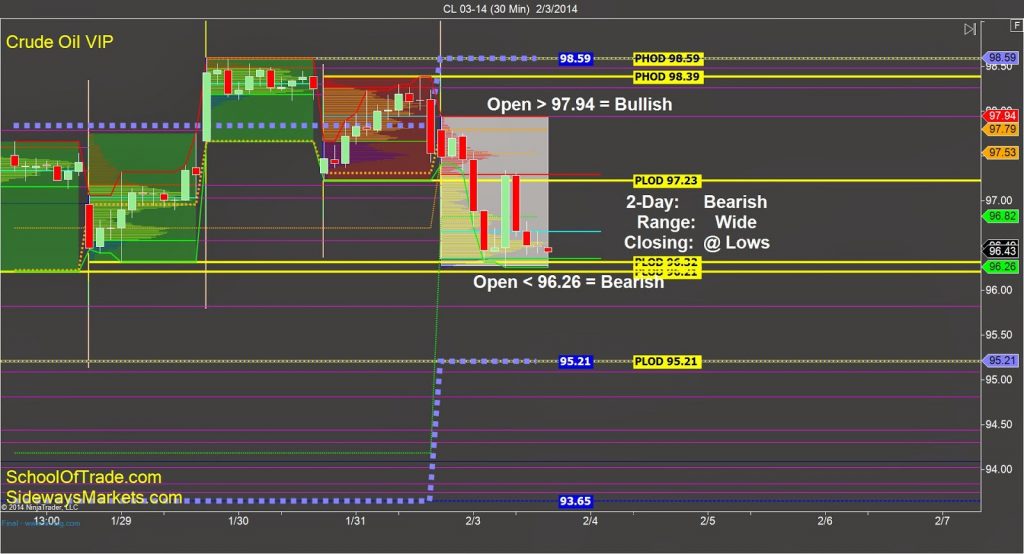
Crude Oil:
VIP Chart:
 |
| Crude Oil VIP Chart |
Today’s price-action was bearish, with a wide trading-range and
a closing-print at the lows of the range.
The wide trading-range tells me to expect a much narrower range
tomorrow, and the closing-print at the lows tells me the sellers never gave up
control over this price-action which is now expected to roll into tomorrow.
a closing-print at the lows of the range.
The wide trading-range tells me to expect a much narrower range
tomorrow, and the closing-print at the lows tells me the sellers never gave up
control over this price-action which is now expected to roll into tomorrow.
 |
| Crude Oil Anchor Chart 1 |
Remember, we don’t predict tomorrow, we are prepared to react
to anything we get tomorrow morning. If the
market opens below 96.26 I am selling short.
If the market opens above 97.94 I am buying long, and if the price-action
stays inside today’s range I’m buying the lows and selling the highs until we
get a breakout of this range, so stay patient.
to anything we get tomorrow morning. If the
market opens below 96.26 I am selling short.
If the market opens above 97.94 I am buying long, and if the price-action
stays inside today’s range I’m buying the lows and selling the highs until we
get a breakout of this range, so stay patient.
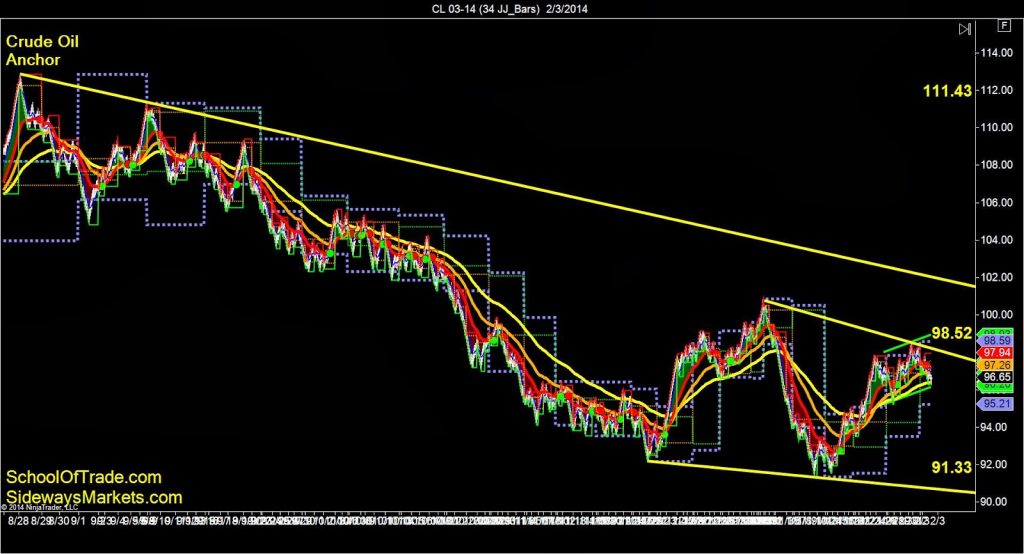
Anchor Chart:
 |
| Crude Oil Anchor Chart 2 |
Crude Oil is looking very bearish this evening on the anchor
chart. We can both the long and short-term
trends are down. We can see lower-lows and
lower-highs, with the exception of just recently we saw a double-bottom,
telling us that we want another lower-low to initiate a short position if we don’t
move into the sell-zone above at 97.10.
chart. We can both the long and short-term
trends are down. We can see lower-lows and
lower-highs, with the exception of just recently we saw a double-bottom,
telling us that we want another lower-low to initiate a short position if we don’t
move into the sell-zone above at 97.10.
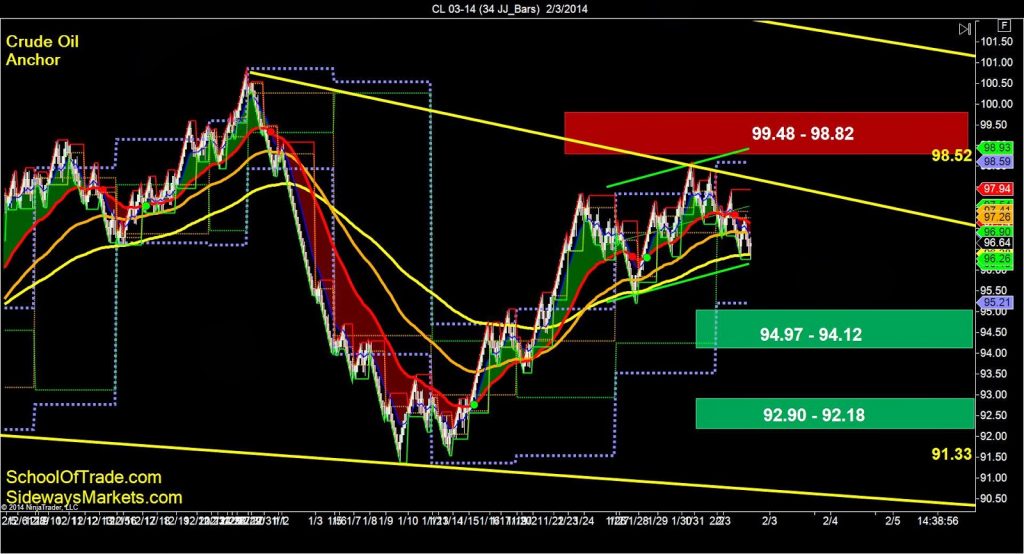
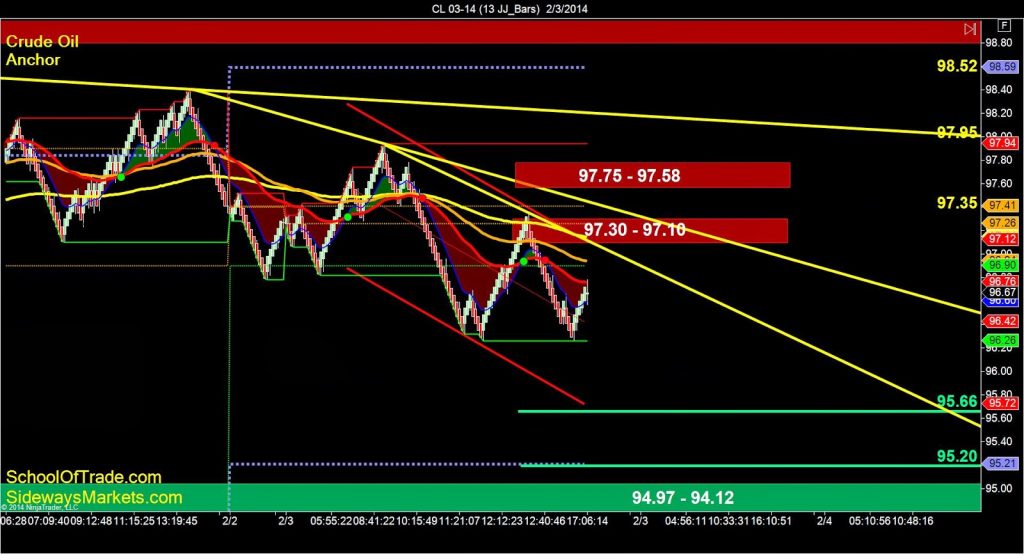 |
| Crude Oil Anchor Chart 3 |
I can see all the key moving-averages are above us right now,
and the only thing I need to worry about is to sell at a premium so I would
rather sell at 97.10, but if I cannot get that entry I will wait for a new lower-low
(below 96.26) and then sell short with a profit-target at 95.66 and 95.20 below
us.
and the only thing I need to worry about is to sell at a premium so I would
rather sell at 97.10, but if I cannot get that entry I will wait for a new lower-low
(below 96.26) and then sell short with a profit-target at 95.66 and 95.20 below
us.
Gold:
VIP Chart:
 |
| Gold VIP Chart |
Gold went the opposite of Crude Oil today, rising almost 1%
after the ISM Manufacturing news came out very weak.
after the ISM Manufacturing news came out very weak.
We can see a bullish 2-day relationship, a typical trading-range,
and a closing-print in the middle of the range.
The closing-print in the middle of the range is the biggest clue in my
opinion, and it tells us that this move higher could easily lose moment and
collapse back off the highs as we go into tomorrow.
and a closing-print in the middle of the range.
The closing-print in the middle of the range is the biggest clue in my
opinion, and it tells us that this move higher could easily lose moment and
collapse back off the highs as we go into tomorrow.
Anchor Chart:
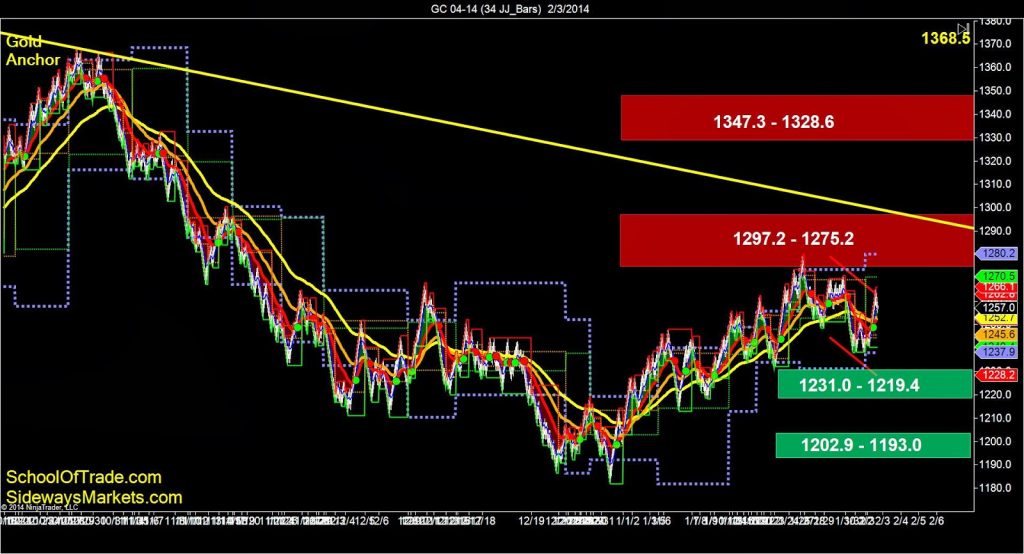 |
| Gold Anchor Chart 1 |
The anchor chart of Gold paints a very range-bound picture
this evening. We can see major support levels
below us, along with major resistance levels above us as we go into the
overnight trading session in the US.
this evening. We can see major support levels
below us, along with major resistance levels above us as we go into the
overnight trading session in the US.
I would define the Gold as being inside a price wedge at this
time, or as we call it… a ‘consolidating market-structure’ which tells me
exactly what to be doing for tomorrow.
time, or as we call it… a ‘consolidating market-structure’ which tells me
exactly what to be doing for tomorrow.
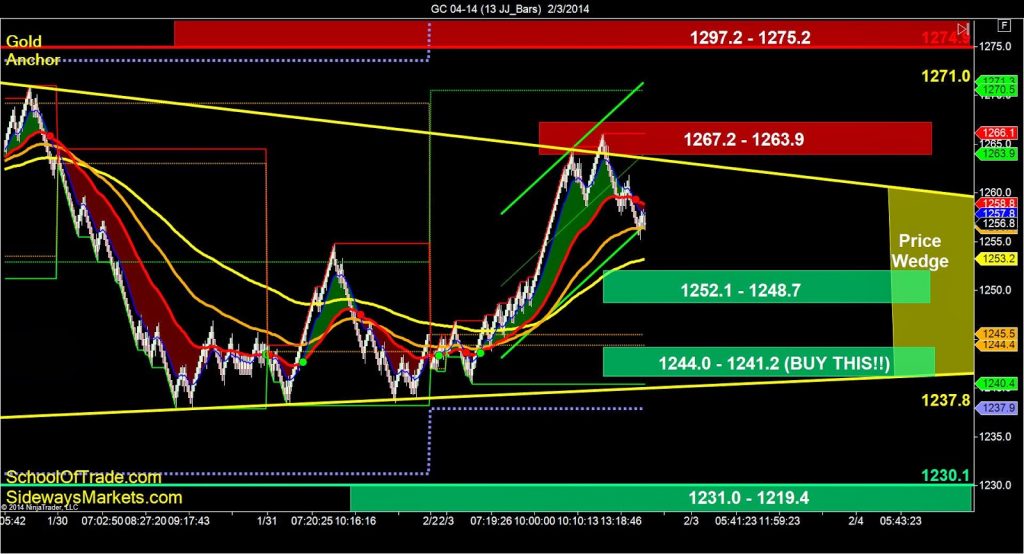 |
| Gold Anchor Chart 2 |
I need to wait for tomorrow’s opening-bell to ring so I can
use the opening-print as the big clue to tell me what direction, and then I
will use the levels on the anchor chart to trade with that directional clue
from the VIP chart.
use the opening-print as the big clue to tell me what direction, and then I
will use the levels on the anchor chart to trade with that directional clue
from the VIP chart.
My goal on this anchor chart is to buy the lows at 1244.0 or
sell the highs at 1263.9 and avoid the middle of the trading-range around the
1250.0 area.
sell the highs at 1263.9 and avoid the middle of the trading-range around the
1250.0 area.
Mini-Russell:
VIP Chart:
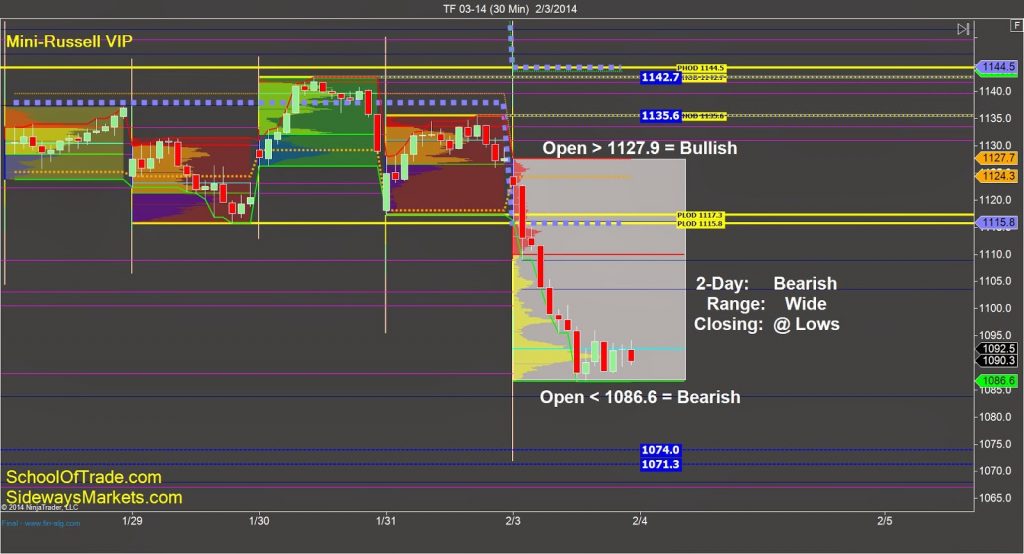 |
| Mini Russell VIP Chart |
WOAH Russell! The
slump in manufacturing combined with less ‘stimulus’ from the Fed is taking its
toll on the e-mini equity futures right now with another day of triple-digit
losses.
slump in manufacturing combined with less ‘stimulus’ from the Fed is taking its
toll on the e-mini equity futures right now with another day of triple-digit
losses.
The 2-day relationship was bearish, the trading-range was
very wide, and the closing-print was at the lows of today’s range. The bearish move tells us the sellers grabbed
control at the beginning of the session, and the closing-print at the lows
tells us that those sellers NEVER took profit or gave back any control to the
buyers.
very wide, and the closing-print was at the lows of today’s range. The bearish move tells us the sellers grabbed
control at the beginning of the session, and the closing-print at the lows
tells us that those sellers NEVER took profit or gave back any control to the
buyers.
The wide trading-range from
today is a very important clue, telling me that tomorrow MAY (we don’t predict)
be a narrower trading-range than we usually get as all the sellers will take
some profit and wait for another REASON to sell short again.
today is a very important clue, telling me that tomorrow MAY (we don’t predict)
be a narrower trading-range than we usually get as all the sellers will take
some profit and wait for another REASON to sell short again.
Anchor Chart:
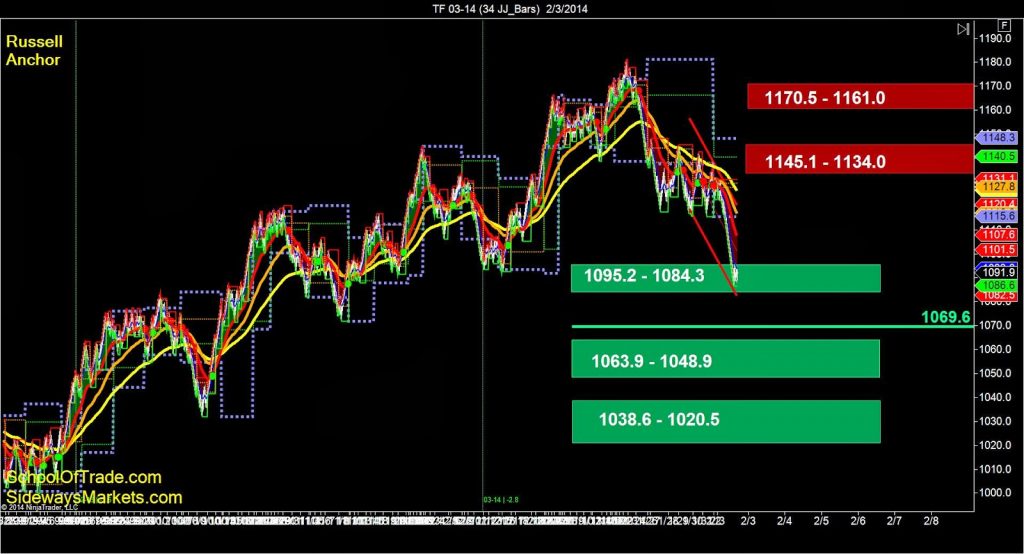 |
| Mini Russell Anchor Chart 1 |
The anchor chart of the Mini-Russell is a great example of a
market that is over-sold, or as I like to call it… “Priced at a discount”. We always want to buy at a discount, and sell
at a premium, so right now we cannot sell short on this very bearish Mini-Russell
until this price-action moves into a ‘premium’ up around 1116.1.
market that is over-sold, or as I like to call it… “Priced at a discount”. We always want to buy at a discount, and sell
at a premium, so right now we cannot sell short on this very bearish Mini-Russell
until this price-action moves into a ‘premium’ up around 1116.1.
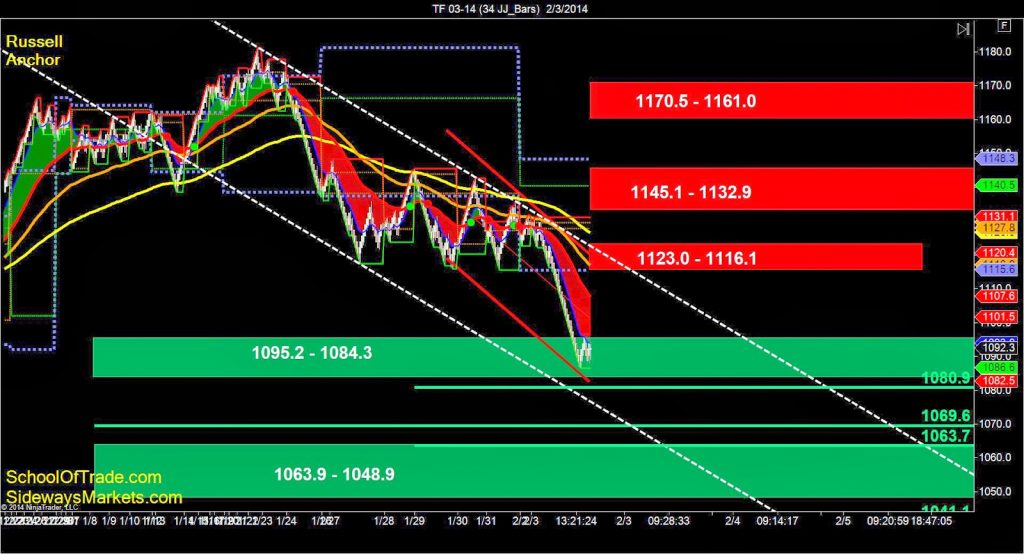 |
| Mini Russell Anchor Chart 2 |
My goal for the Mini-Russell is to sell this as price moves
lower, focused on selling at a premium and at resistance levels overhead, such
as the highs of this bear price channel or the sell-zone at 1116.1 to 1123.0.
lower, focused on selling at a premium and at resistance levels overhead, such
as the highs of this bear price channel or the sell-zone at 1116.1 to 1123.0.
Once I get short on this Mini-Russell I am going to use the support
levels below me as profit-targets at 1080.9, 1069.6, 1063.7, and so forth.
levels below me as profit-targets at 1080.9, 1069.6, 1063.7, and so forth.
===========================================================
Want to see us trade LIVE?
Click here to register for the
Free Trial!
Click here to register for the
Free Trial!
Automated Trading Strategy; Let the
Computer do the trading
Computer do the trading
Are you a Crude Oil Trader? Click here to
trade Crude Oil
trade Crude Oil
Are you a Euro Trader? Click here to
trade Euro
trade Euro
Are you an E-Mini Russell Trader? Click here to trade
E-Mini Russell
E-Mini Russell
Are you a Gold Trader? Click here to trade
Gold
Gold
Join the Premier Live trade-room as an Advanced Member