April 26, 2011
- in Uncategorized by schooloftrade
A little personality goes a LONG way day trading Gold and Crude Oil Futures

Let’s review the Gold Futures this morning
– 89range chart shows us the BIG PICTURE and the most important levels we need to use today
o We see a bullish price channel and we are at the highs
o We have two sideways ranges, 1 very wide and 1 much narrower
o We have a price wedge which confirms price action is getting narrower
o Shows us some major levels of support is price is to drop
o Shows us major levels of resistance if price rises
– Now let’s use the 34range chart on GC 06-11 and find the exact price levels where we need to be trading
o There is no distinct short term dollar trend, so there is no bias in the direction this morning
o The new FOMC Meeting Format may impact gold more than any other market
o Since the US Dollar will be on the minds of traders with this new FOMC format the GOLD is assumedly going to be sloppy right along with it
o We have the most recent price wedge in blue trend lines and we are at the HIGHS of this wedge
Our plan of attack on the Gold Futures will be as follows:
– If price rises
o Selling resistance first, then buying a pullback with new higher highs
o Selling resistance levels at 06.4 the highs of the channel, 08.5, 11.6, 13.7, and the major resistance of 19.2
o I will not buy the highs, I will sell the highs, and then buy pullbacks when we see there is no selling opportunity to take
– If prices fall:
o Im buying at support first, then selling new lows with a retracement second
o Im buying support levels at 01.8, 95.9, 93.8, 88.2, 84.0, major support at 77.8
o Beware trading around the big money trigger line at 1492.5 it will be sloppy
o I also need to beware the lows of the wedge will also be sloppy around 98.7 to 1500. Around the open of the day
845am est
– We have the short term dollar trend = flat
– No trend on the 13range DX 06-11 we assume this will also result in narrow sideways range on the markets we trade most
– This is not a bad thing, we can trade sideways range all day long
– The SPEED of the market will be the main concern, not the ranges
– The speed may change at any time, so lets be ready
940am est
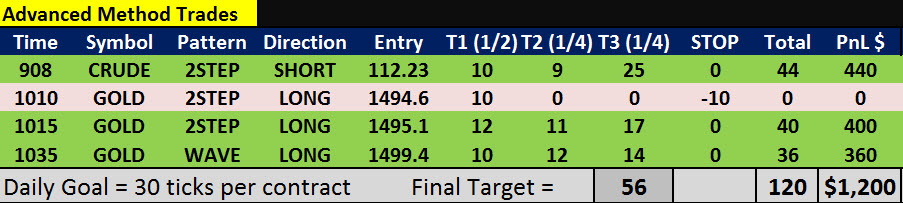
– We took our first trade on crude oil for 45 ticks of profit to kick start our day
– Now the markets make it slowly through the us open
– We have a narrow wedge on crude oil that was just broken, and price is sitting at the BMT levels on the lows of the wedge
– Lets wait for the best places to take our next trade
Crude Oil:
– Wait to buy the lows as price drops.
– Wait for buying at support as price drops
– Buying 111.24 support
Gold Futures:
– We are seeing very slow and inconsistent speed of the tape on the GC 06-11
– This is likely due to the dollar index being slow
– And this is caused by the new FOMC Format today/tomorrow
– We have gold trading around the OPEN of the day, so this is always considered high risk
– The open = nothing has happened (no buyers or sellers)
– We are also trading around 1500.00 which is a BIG BIG Round number
– Half way between 1000 and 2000 on gold is 1500, this is why we may see price sit here for a while and go sideways
– Focus on the best AREAS to trade, this will make it easier to avoid your emotions
– I want to buy the PLOD and the Lows of the wedge at 95.9
– If we break new lows below PLOD I will then sell a retracement
– If price rises im selling the resistance at 1502.9 which is the 34r trigger line and the highs of the bearish price channel
– If price keeps making new highs I will then buy pullbacks
– I will not buy the highs and will not sell the lows
1055am est
– We’re waiting for better price action, its very slow
– We hit our daily goal today with 120 ticks (30 ticks per contract) and our members and guests and learning and earning as well
– Now we see the average true range on crude oil compared to the SAME TIME on Monday looks HORRIBLE
– ATR = dropping = narrower ranges = less potential for your trades to work
– Dollar index also shows dropping Average True Range, this tells us the MAJORITY of the markets are getting narrower
– We saw the personality slow down a little after 10am
– Now at 11am est we see the ATR drop, the market slows down, and we now know this morning may be coming to an end.
Before we call it quits and head to the bank, lets plan our day on crude if we get another pattern:
– If price rises
o Selling resistance at the highs of the day HOD and the highs of the recent trading range at 112.64
o If we break new highs above the HOD, I need to beware trading around the OPEN from Monday @ 112.66
o I will look to buy a pullback once we see buyers confirm they are in control and moving higher above the 112.66
o We don’t want to buy with overbought momentum b/c the OPEN will be sloppy
– If prices fall
o Sell below 112.00 big round number
o We can try and sell the highs of the wedge, but we have too many trigger lines as support in our way
o We don’t want to buy the 112.00 because we have too much around it
o Wait for 112.00 to break and then sell a retracement
o I will then buy at support at 111.77, 111.55, 111.24, 111.12
o Those levels of support also make excellent profit targets
o Those levels were located easily with our Auto Levels Indicator