July 1, 2013
- in Uncategorized by schooloftrade
Gold Day trading strategy

Gold daily
Chart:
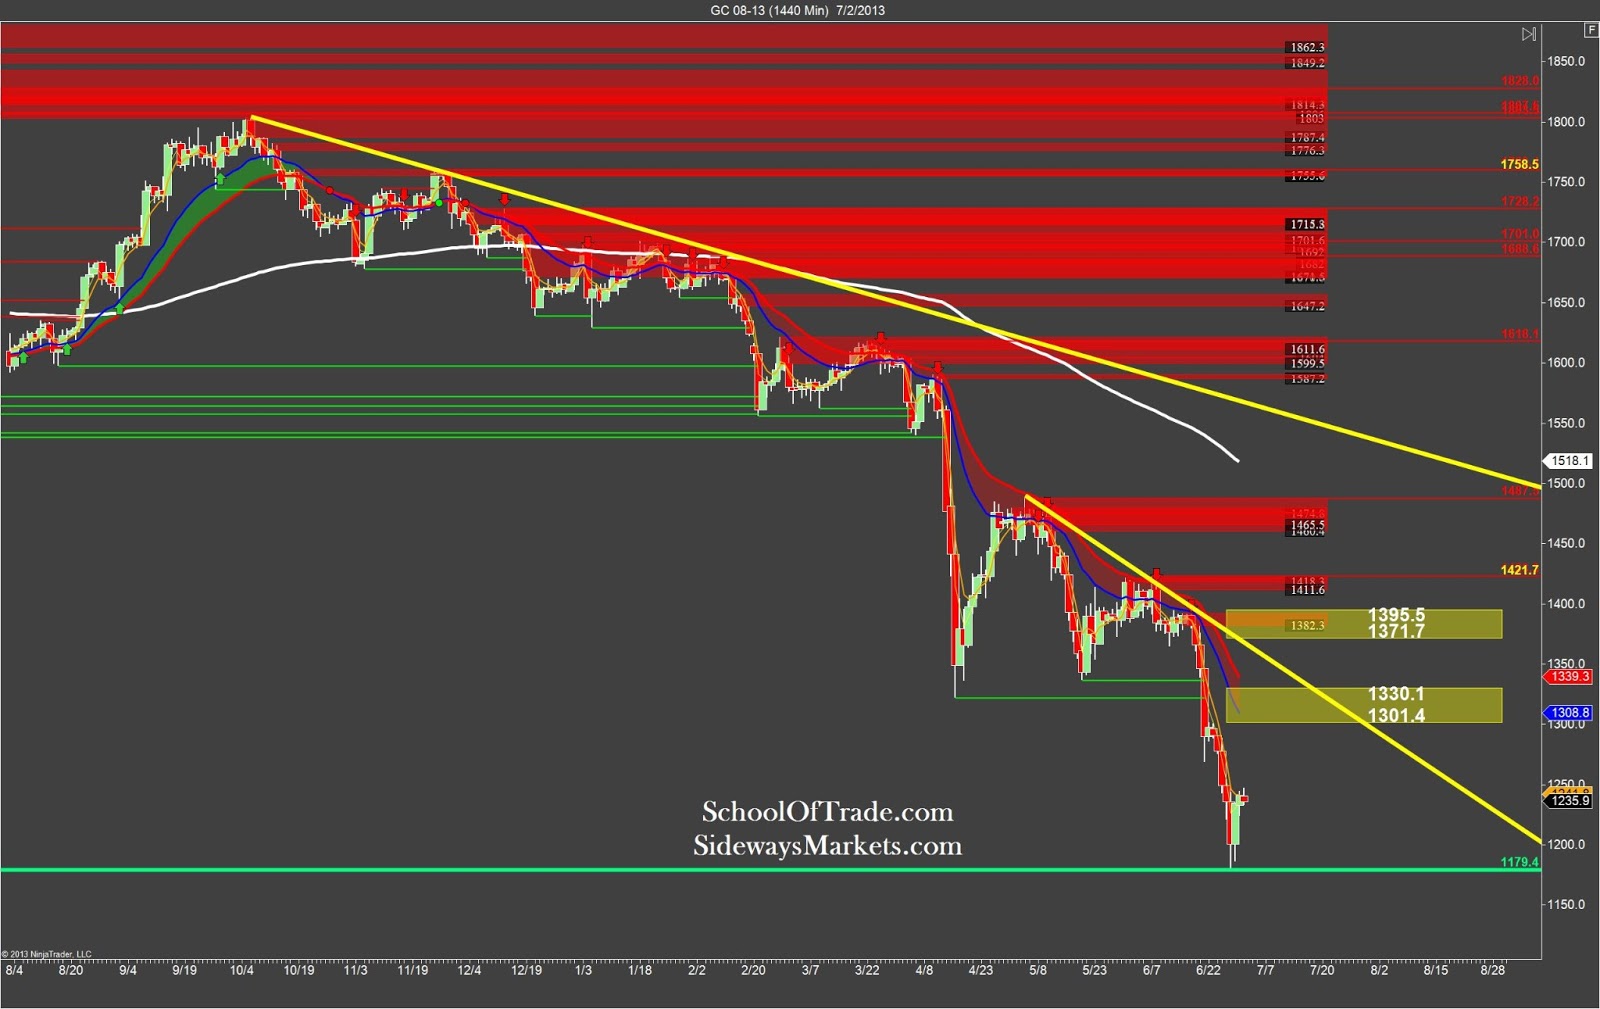 |
| Gold Daily Chart 1440 Minute |
We can see
that Gold is bearish in market sentiment this morning, making a new yearly low
last Friday at 1179.4. Now we know there
will most likely be a retracement higher to the 1301.4 area before it heads
back to new lower-lows. We will look for
short term buying opportunities this morning, and long term selling-opportunities
this week on gold. Remember the market
personality last week was VERY bearish, so if this price-action takes off to
the downside we can assume the sellers have returned to the same market
personality as last week and we will resume selling retracements down to the
yearly low of 1179.4, take our profit-target and then look for new lower-lows to
sell retracements once again.
Gold 4-hour
chart:
chart:
 |
| Gold 4-hour Chart 240-Minute |
We can see
on the 240-minute anchor chart that we are ready to start selling NOW with the trigger-zone
overhead at 1254.4 down to 1240.1 so we do NOT have the option for buying at
this time unless some drastic market personality takes over. We know the high-percentage-trades are
selling short, and this 4-hour anchor chart tells us the story.