March 26, 2013
- in Uncategorized by schooloftrade
Gold day trading plan

 |
| Gold day trading |
Gold is
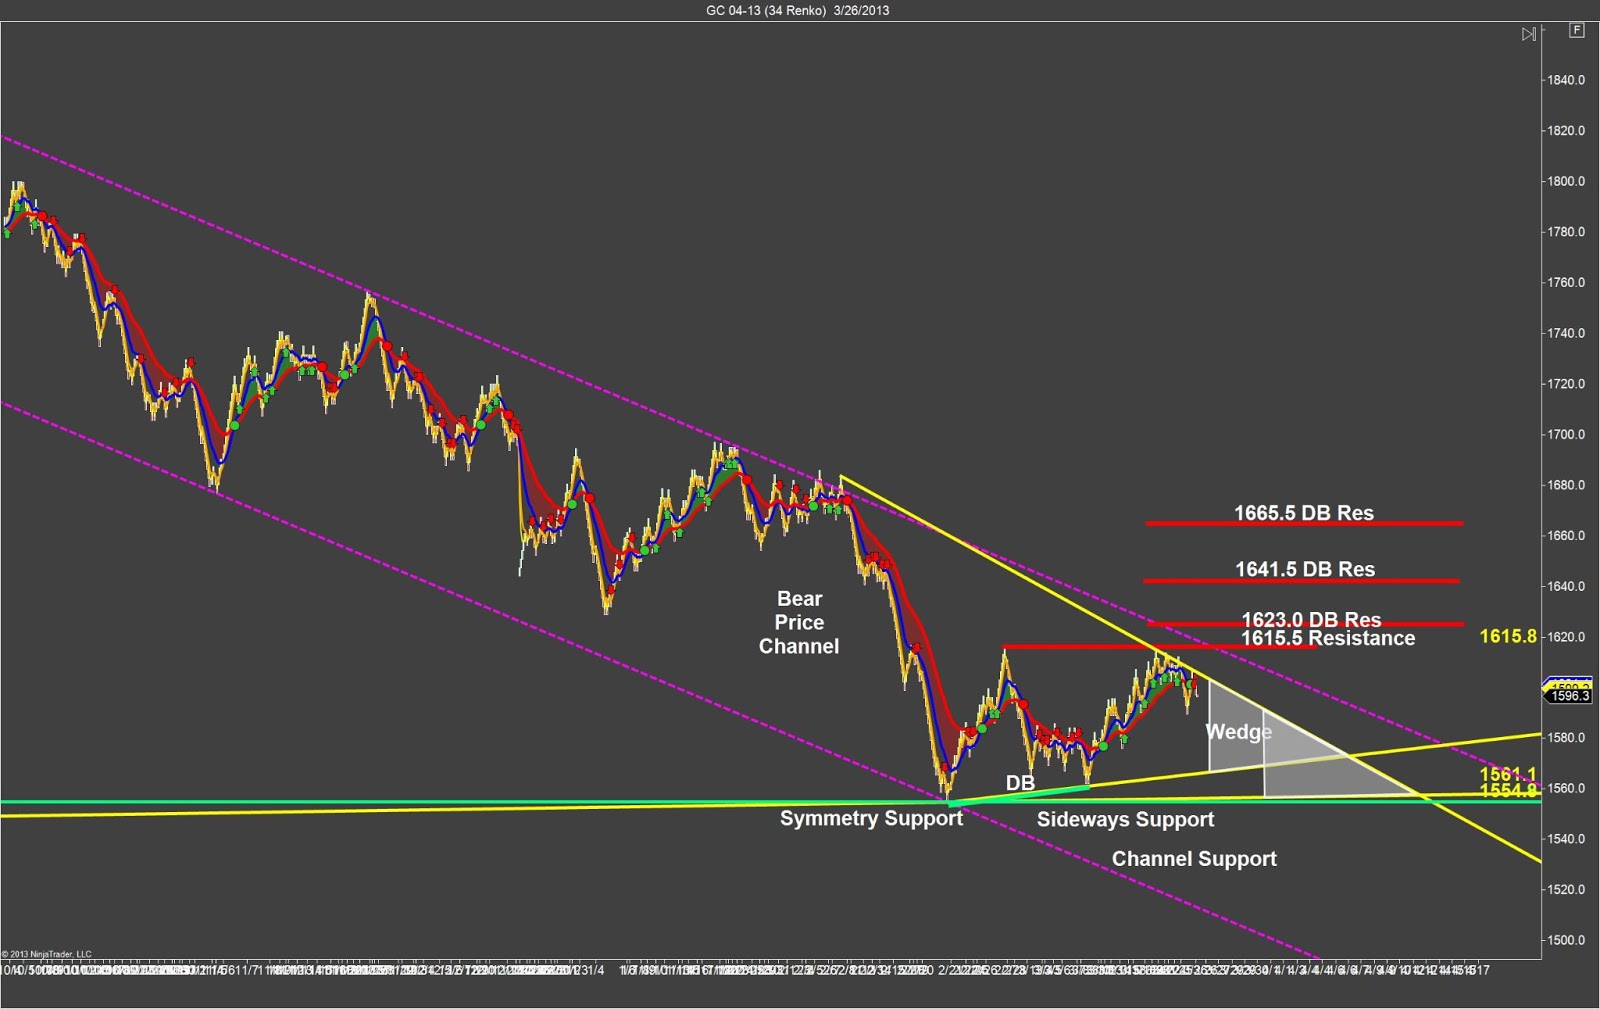
trading at major resistance this morning on the anchor chart #1 which tells us
that this market personality is most likely trying to move now down to support. We can see this short term bearish price-wedge
has developed and we will assume price-action will move down today towards the
lows around the 1567.0 area.
 |
| Gold day trading |
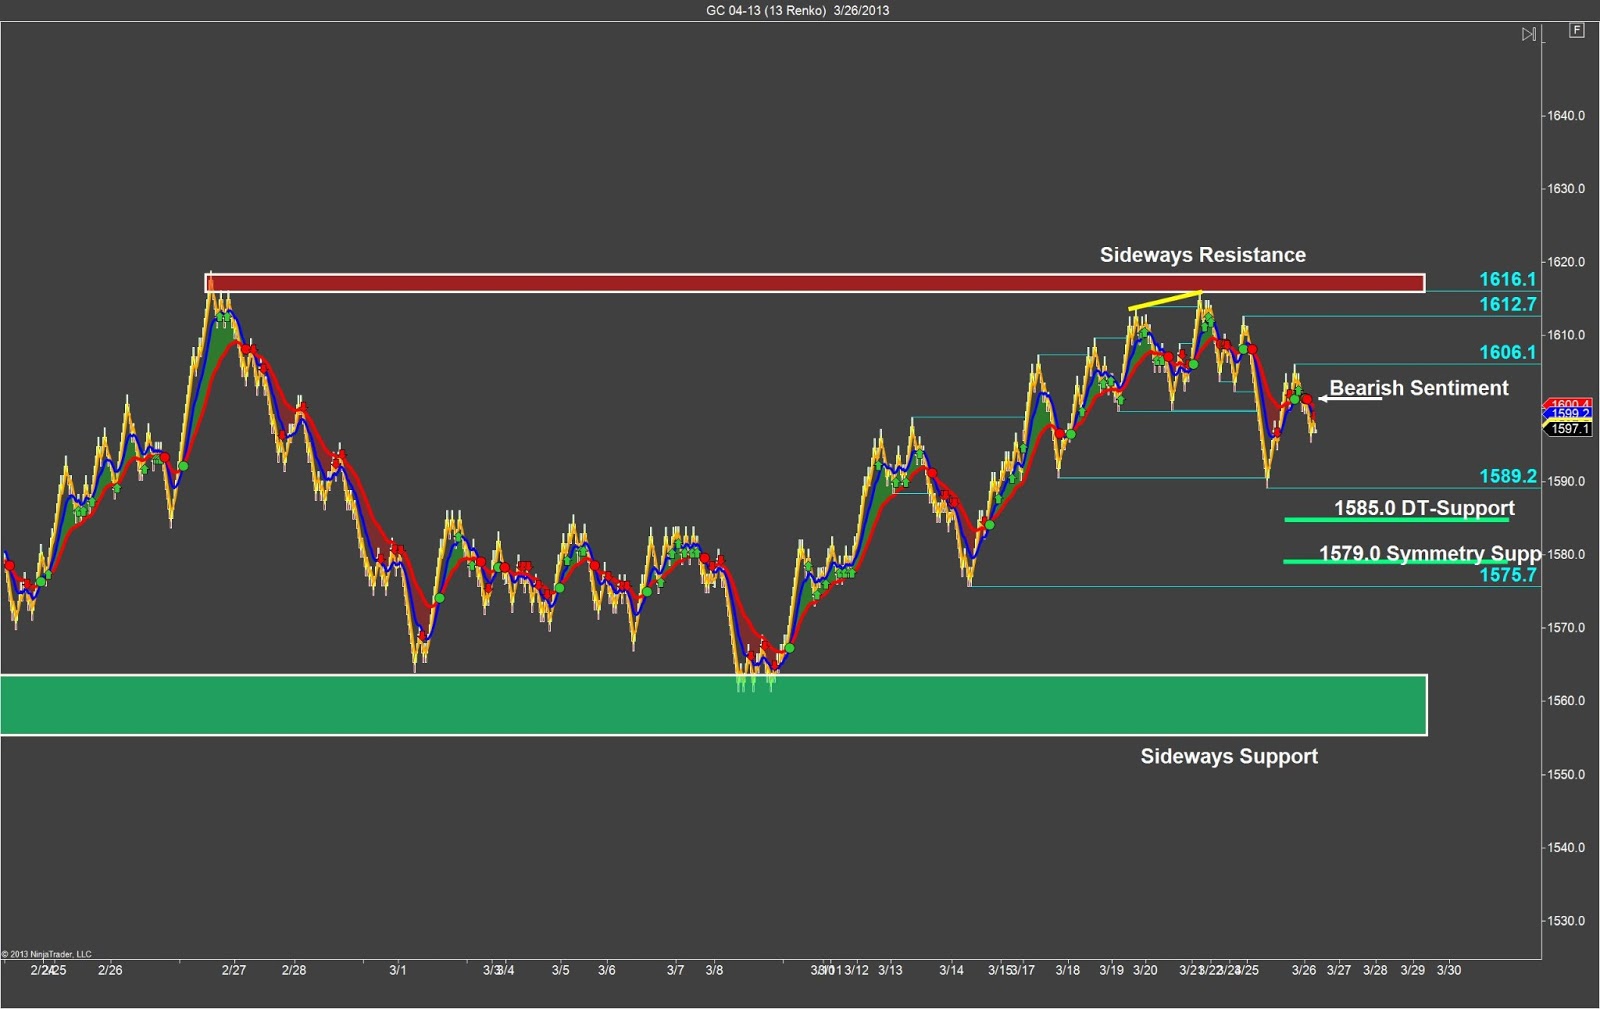
The anchor
#2 on Gold Futures shows us a clear sideways-trading-range and we are moving
down off the highs, so this morning we are bearish on Gold until something
tells us differently. We can see symmetry
support below us as we move lower at 1579.0 which makes for an easy seller’s profit-target.
#2 on Gold Futures shows us a clear sideways-trading-range and we are moving
down off the highs, so this morning we are bearish on Gold until something
tells us differently. We can see symmetry
support below us as we move lower at 1579.0 which makes for an easy seller’s profit-target.
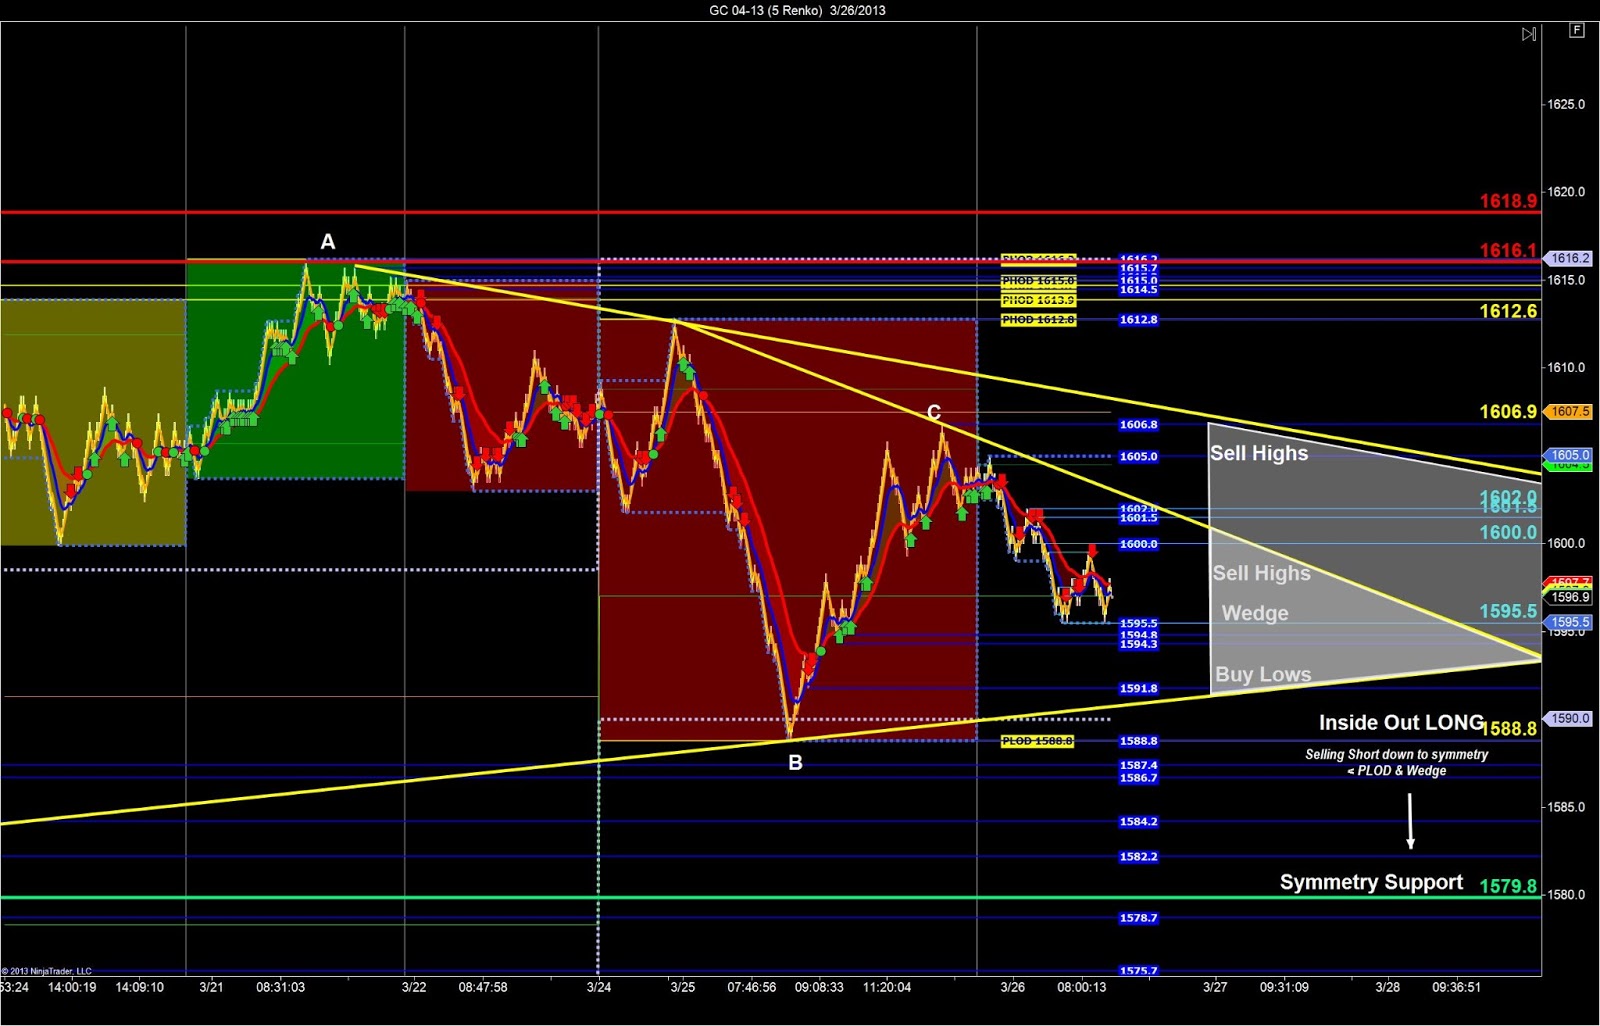
The entry
chart timeframe (fastest) shows Gold trading in the middle of the range from yesterday
and we’ve drawn trend lines from the swing-lows and swing-highs which creates a
short term and very narrow price-wedge. We
will use this price-wedge as our guide for profit-targets and times to avoid a
trade along the way.
 |
| Gold day trading |
We’re looking
to sell short down to the support at 1591.0 and then look to buy the lows if
the sellers fail. If we make new lower-lows
below the PLOD 1588.8 we will then look for the fake-out-breakout and if the
sellers are strong enough we’ll get entry trigger short and take the short
trades down to the symmetry support at 1579.8.
If price action moves HIGHER we will sell the highs of the price-wedge and
look for the fake-out-breakout if we make new higher-highs for a selling
opportunity.
look for the fake-out-breakout if we make new higher-highs for a selling
opportunity.