March 6, 2013
- in Uncategorized by schooloftrade
Gold Chart Prep

Gold Chart Prep |
The anchor
chart on Gold shows us trading in a sideways-trading-range at the double-bottom
and symmetry support at 1565.0. If we
look lower we can also see that the lows of the major bear price-channel are
down around 1540.0. this tells us a few
things; if price makes a new lower-lows we can use the 1540.0 area at the price-channel
lows as an easy profit-target for sellers.
At the same time, if this support at 65.0 holds and the buyers bring it
back up we can use our Max Entry-Trigger and the InsideOut Set-up on the entry
chart to get long.
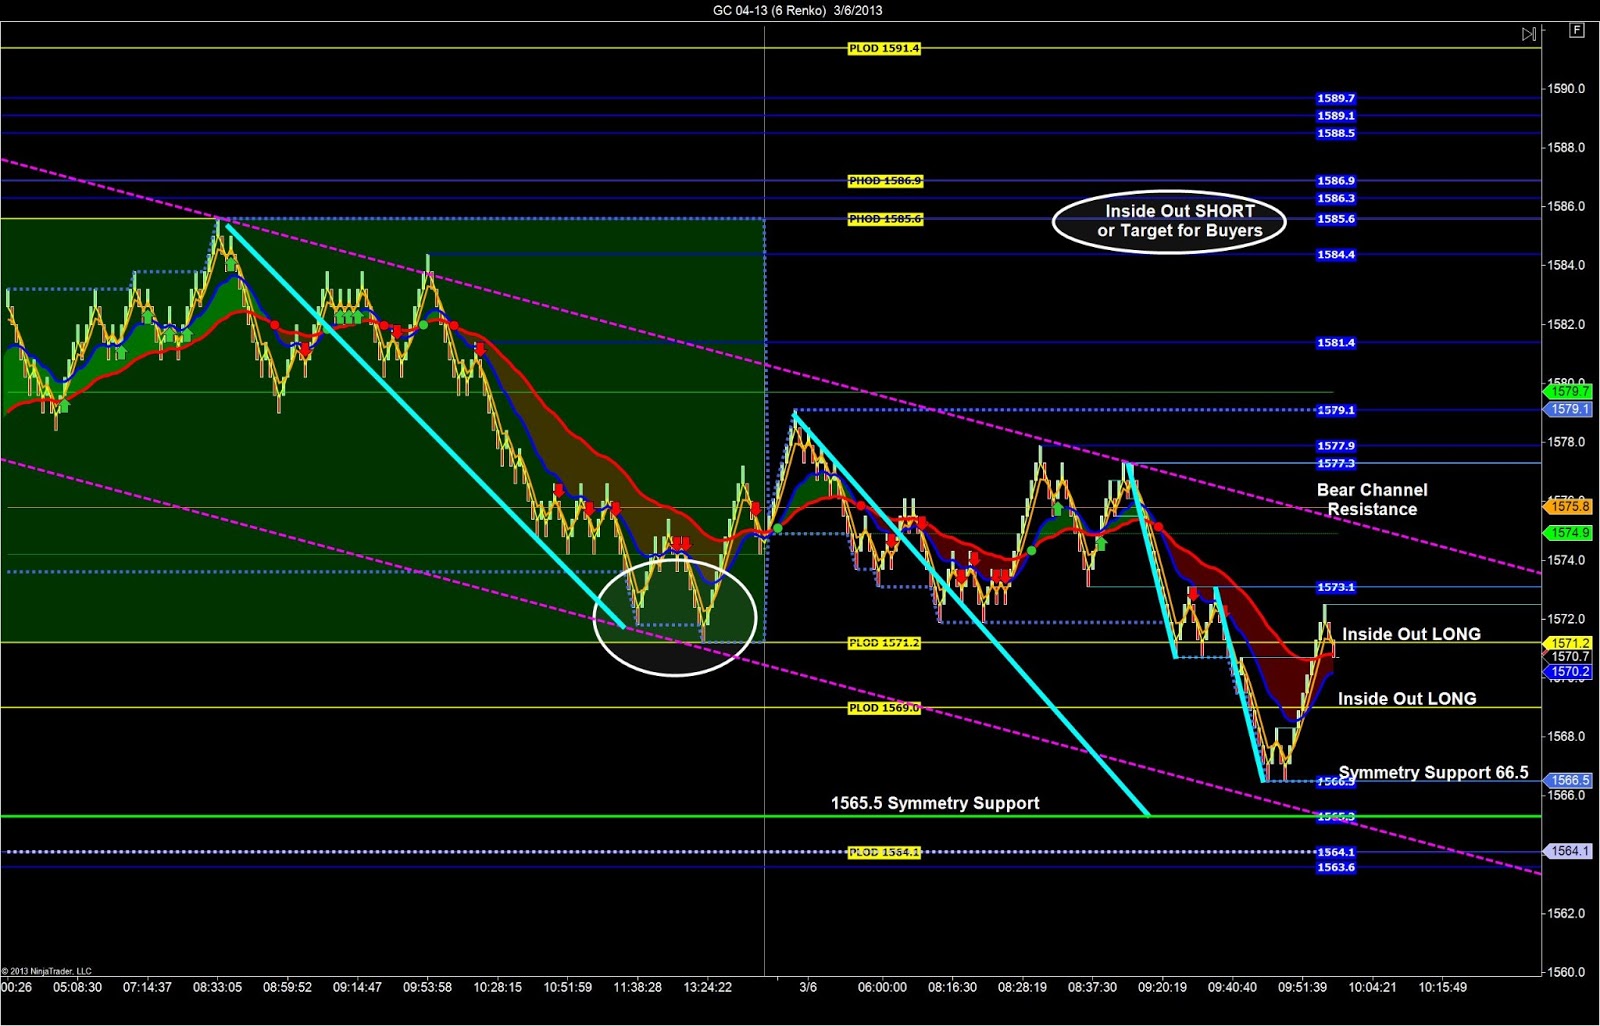 |
Gold Entry Chart Prep |
We are looking to buy when Gold moves back above the PLOD of 1571.2 and use the bear channel highs as a profit target, with a runner left on the table up to the PHOD at 1585.6