March 1, 2013
- in Uncategorized by schooloftrade
Gold Anchor Chart Prep

 |
Gold Anchor Chart Prep |
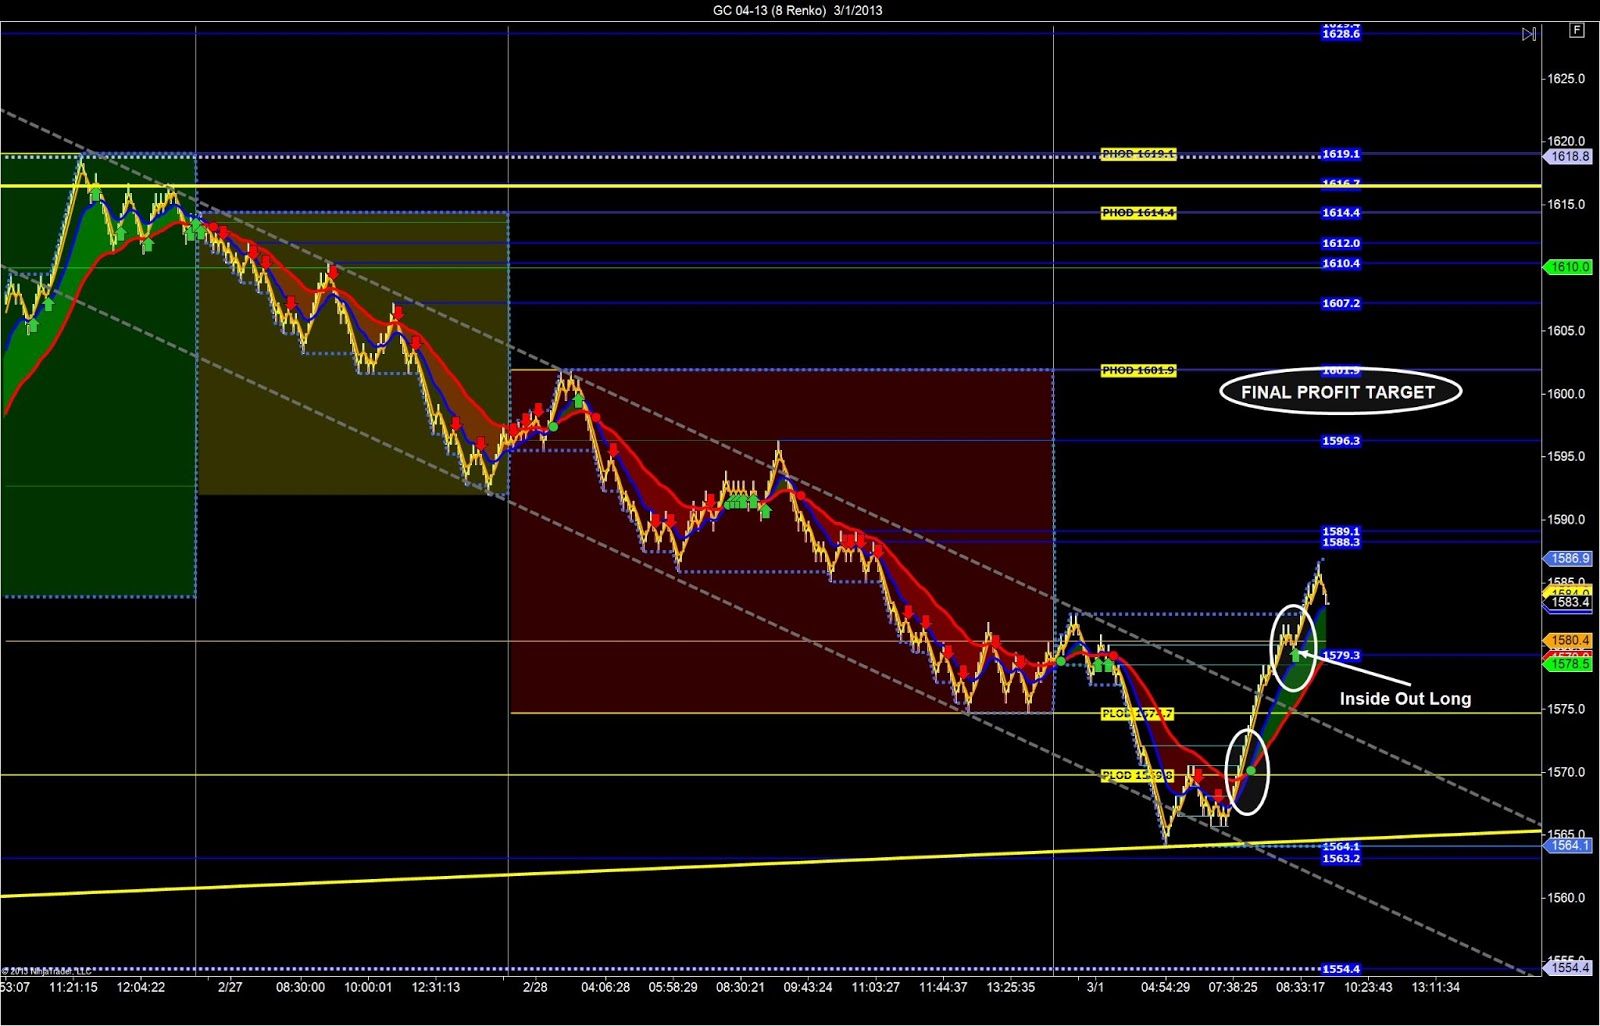
Gold has
moved lower this morning and now has bounced off the recent lows and has moved
back above the PLOD and we’re looking for a buying opportunity with an entry
signal above the 1574.7 and we will use the PHOD as a profit-target at 1601.9.
moved lower this morning and now has bounced off the recent lows and has moved
back above the PLOD and we’re looking for a buying opportunity with an entry
signal above the 1574.7 and we will use the PHOD as a profit-target at 1601.9.
We can see
the anchor chart is giving us a bearish directional bias, along with major symmetry
support which is a big clue for us at this time. If price bounces and moves higher we know
that the 1700.0 area resistance is going to be tested, and we will use the InsideOut
Set-up on our entry chart to take the trade long. If price trades sideways we will either sit-on-hands
in the middle of the short term range, or we will buy-the-lows at support and sell-the-high
at resistance of this new sideways-trading-range.
And finally,
if price moves lower this morning we have recently seen the bias turn to
bearish and we will be looking for the high-percentage-set-ups that come with
new lower-lows.
if price moves lower this morning we have recently seen the bias turn to
bearish and we will be looking for the high-percentage-set-ups that come with
new lower-lows.
 |
Gold ENTRY Chart Prep |
Our anchor
chart on gold shows us a recent double-bottom and we have 3 levels of resistance
according to this set-up. We can see
that if price was to rise to the highs of the most recent trading range we will
likely get a chance to sell the 1622.5 level along with the swing-high resistance
just below it.
chart on gold shows us a recent double-bottom and we have 3 levels of resistance
according to this set-up. We can see
that if price was to rise to the highs of the most recent trading range we will
likely get a chance to sell the 1622.5 level along with the swing-high resistance
just below it.