February 4, 2013
- in Uncategorized by schooloftrade
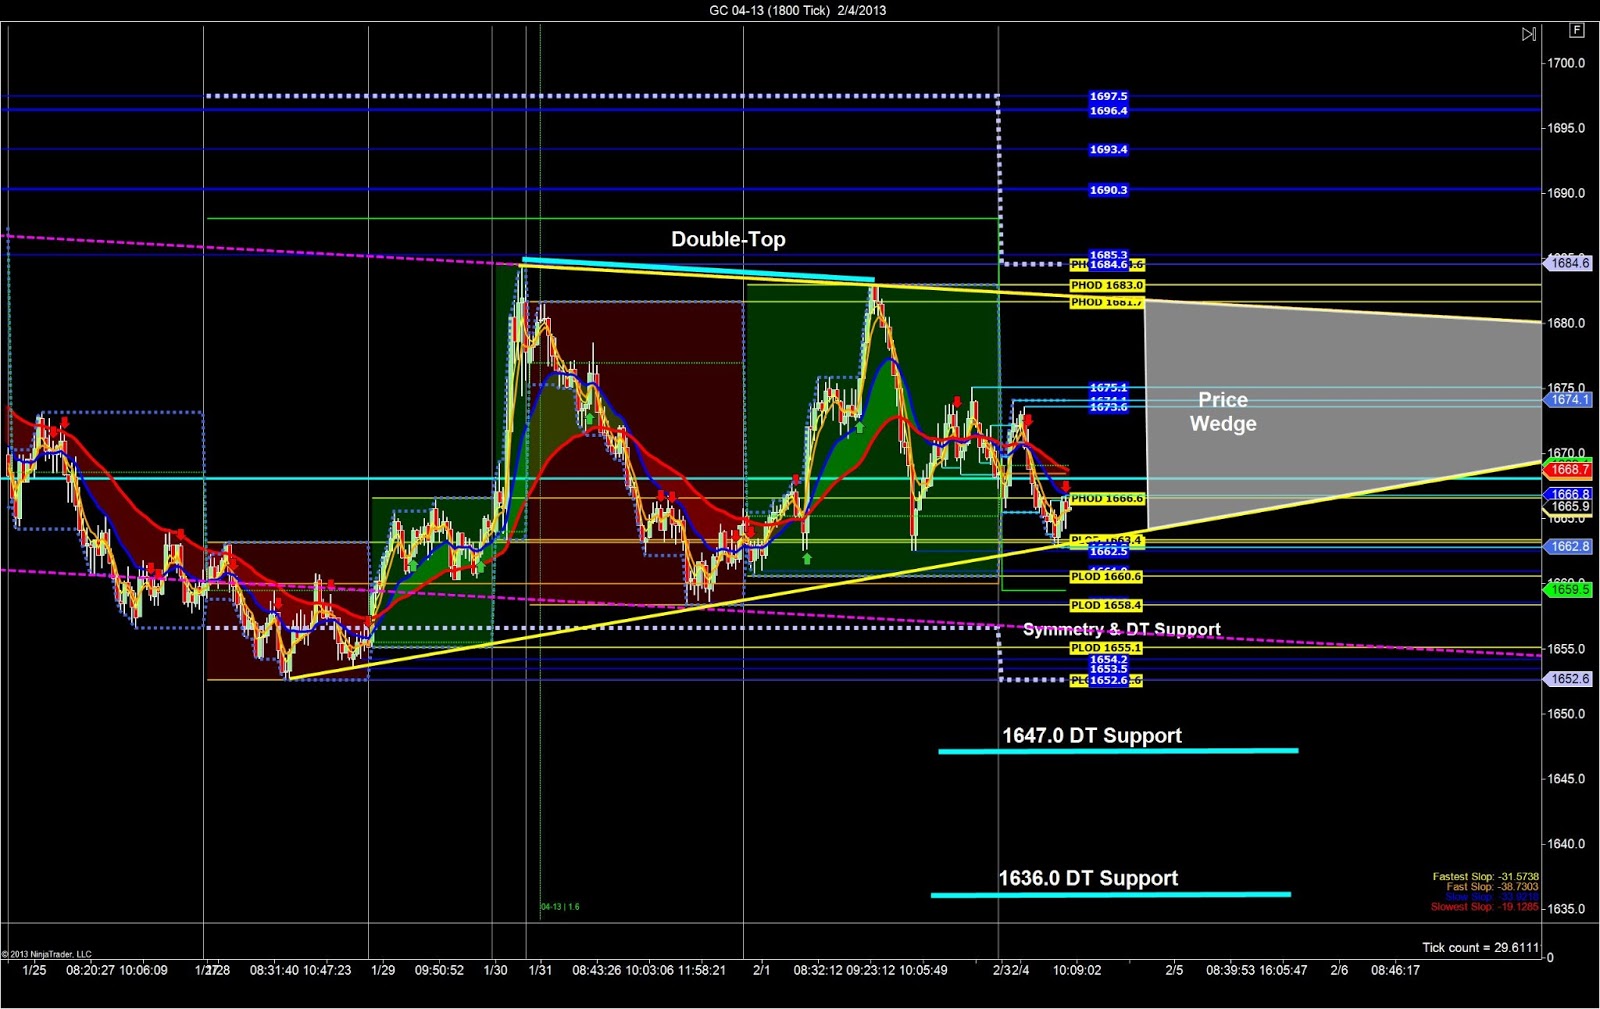
Gold Anchor Chart Prep

 |
| Gold Anchor Chart Prep |
The first
thing we notice on gold futures is the sideways-trading-range we can easily see
on this anchor chart. When we see
sideways price-action we know to look for the InsideOut Set-up and the price-wedge
set-up.
thing we notice on gold futures is the sideways-trading-range we can easily see
on this anchor chart. When we see
sideways price-action we know to look for the InsideOut Set-up and the price-wedge
set-up.
The next
potential set-up will be the InsideOut Set-up and we will be looking for this
around the PLOD from Friday at 1660.6, or at the PHOD from Friday at 1683.0.
potential set-up will be the InsideOut Set-up and we will be looking for this
around the PLOD from Friday at 1660.6, or at the PHOD from Friday at 1683.0.
We can see
symmetry set-up support at 1655.0 area using the most recent swings.
symmetry set-up support at 1655.0 area using the most recent swings.
We can see
the double-top at the 1683.0 resistance level which provides us with the major support
starting at 1655.0, and additional support at 1647.0 and 1636.0. we will be looking for a price-reversal trade
at these levels of support.
the double-top at the 1683.0 resistance level which provides us with the major support
starting at 1655.0, and additional support at 1647.0 and 1636.0. we will be looking for a price-reversal trade
at these levels of support.
The price-wedge
is the most dominant price-structure we can see on this chart, and that will be
our focus this morning. We want to buy-the-lows at support and sell-the-high at
resistance of the price-wedge. Also remember
that if we test, and break the new lower-lows we will be very careful not to
sell short directly into the 1655.0 support and look for the price-reversal off
the lows so we can buy the PLOD and the lows of the price-wedge. We would love to buy the lows of this price-wedge,
especially when the new lower-lows have recently failed.