January 23, 2014
- in Uncategorized by schooloftrade
Focus moves to China; Day Trading Newsletter 01/23/14; SchoolOfTrade.com

“Most people have no idea of the giant capacity
we can immediately command when we focus all of our resources on mastering a
single area of our lives.”
Reflections from Today:
·
Chinese
PMI news overnight stirs up the markets
Chinese
PMI news overnight stirs up the markets
·
Chinese
PMI showed ‘contraction’ first time in 6 months
Chinese
PMI showed ‘contraction’ first time in 6 months
·
US
News did very little change the overnight momentum
US
News did very little change the overnight momentum
·
Bad
news sends equity markets tumbling off highs (-.65% @ 1171.9)
Bad
news sends equity markets tumbling off highs (-.65% @ 1171.9)
·
Bad
news sends Gold higher (+2.25% @ 1264.0)
Bad
news sends Gold higher (+2.25% @ 1264.0)
·
Crude
Oil bucks the trend and keeps pushing higher! (+.65% @ 97.35)
Crude
Oil bucks the trend and keeps pushing higher! (+.65% @ 97.35)
·
Crude
Oil reminds us that when ‘bad news is still good news’ we are officially
trading a BULL MARKET.
Crude
Oil reminds us that when ‘bad news is still good news’ we are officially
trading a BULL MARKET.
Economic News for Tomorrow:
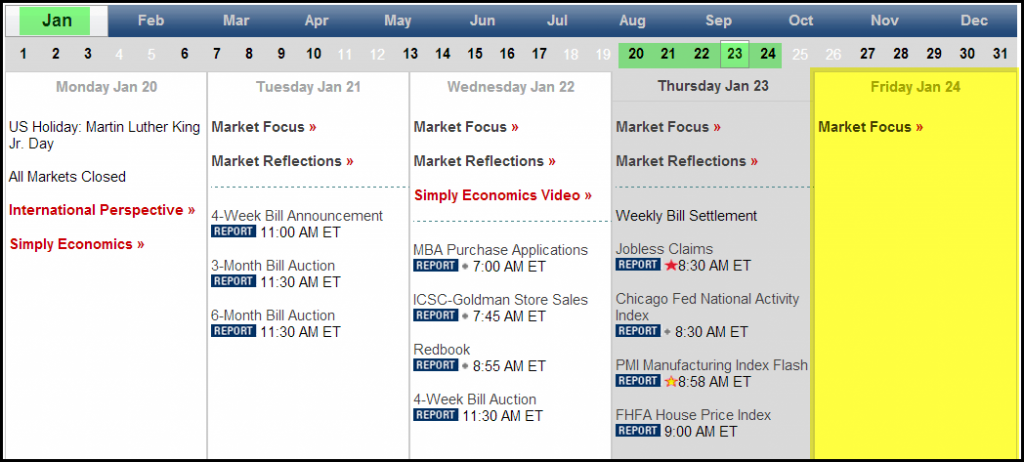
Tomorrow’s economic news calendar is
completely empty,
which is a rare occasion, and something to think about following today’s big
sell-off in equities and jump higher in gold.
completely empty,
which is a rare occasion, and something to think about following today’s big
sell-off in equities and jump higher in gold.
We will
expect to see a slow day tomorrow, Friday, as traders finish up the week of
trading and hit the weekend.
expect to see a slow day tomorrow, Friday, as traders finish up the week of
trading and hit the weekend.
Friday are
always going to be ‘early in and early out’ which means we will be looking for trading
opportunities early tomorrow morning and finishing trading just after 12pm EST
with no afternoon trading.
always going to be ‘early in and early out’ which means we will be looking for trading
opportunities early tomorrow morning and finishing trading just after 12pm EST
with no afternoon trading.
Day trading plan for Tomorrow:
Crude Oil:
VIP Chart:
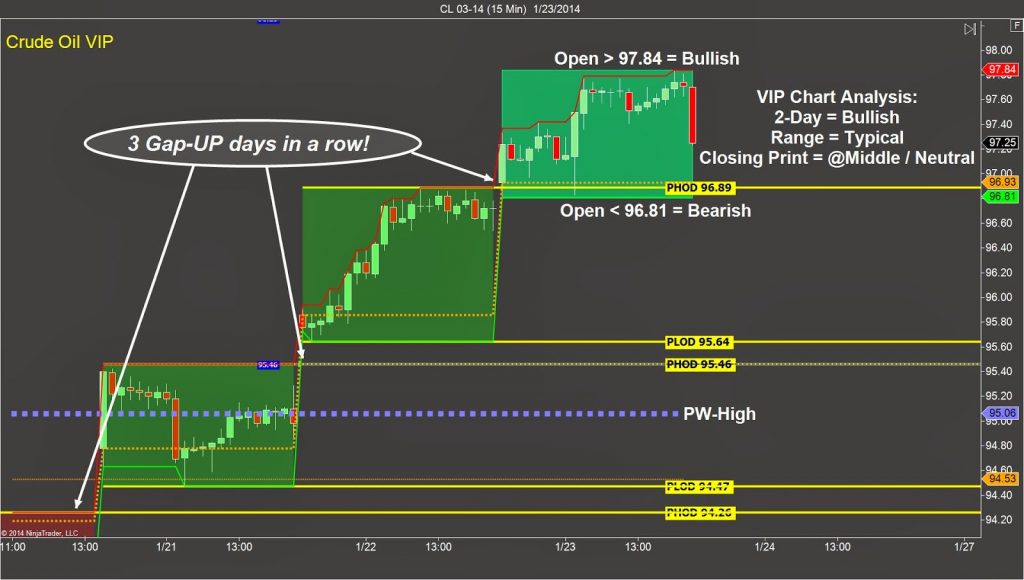
Crude Oil is looking very bullish this week and our VIP Chart
gives us some important clues for tomorrow’s trading session.
 |
| Crude Oil VIP |
First, three days in a row of gaps
to new highs at the opening-bell tells us the buyers are excited to be buying
right now, apparently they see this price below $100 per barrel as a
bargain?
to new highs at the opening-bell tells us the buyers are excited to be buying
right now, apparently they see this price below $100 per barrel as a
bargain?
Second, the closing-print today was back in the middle of the
range, which suggests that today’s VERY bullish market-sentiment
may be coming to an end.
range, which suggests that today’s VERY bullish market-sentiment
may be coming to an end.
Third, tomorrow’s opening-bell will tell us exactly what the
plan of attack will be. If we open above
97.84 we are bullish again and buying
pullbacks. If we open below
96.81 now we know those buyers took profit and the sellers grabbed control so we
will sell short below the 96.81.
plan of attack will be. If we open above
97.84 we are bullish again and buying
pullbacks. If we open below
96.81 now we know those buyers took profit and the sellers grabbed control so we
will sell short below the 96.81.
We don’t have ANY news tomorrow, and on a Friday that means
there will be less volume than on a normal day, so the likelihood of price-action
opening in the middle of the range (between 97.84 and 96.81) is very high and
we will consider buying
the lows at support and selling the highs at resistance tomorrow morning.
there will be less volume than on a normal day, so the likelihood of price-action
opening in the middle of the range (between 97.84 and 96.81) is very high and
we will consider buying
the lows at support and selling the highs at resistance tomorrow morning.
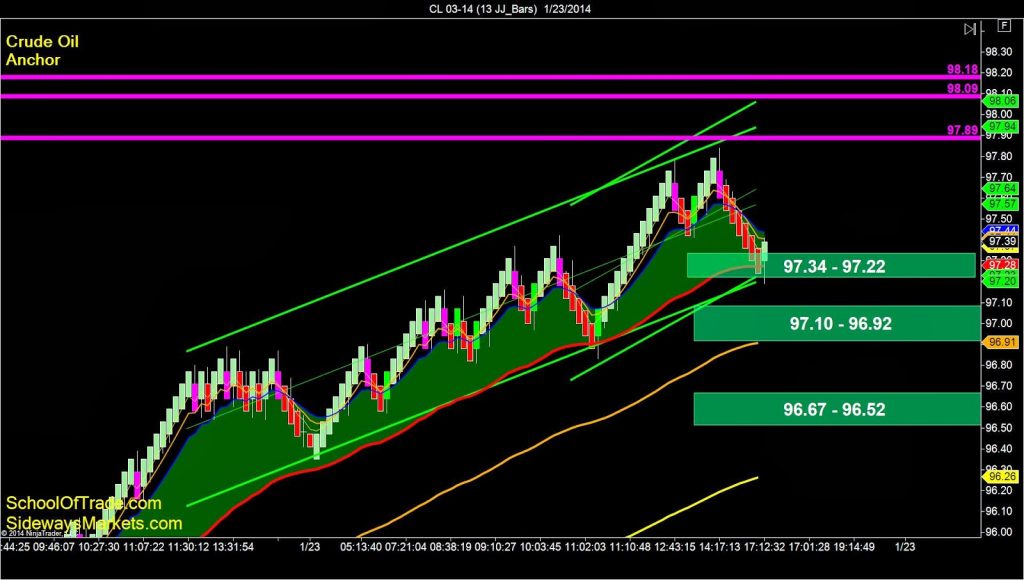
Anchor Chart:
 |
| Crude Oil Anchor 1 |
Crude Oil continues to look VERY bullish on this evening’s
anchor chart. We can see a
quadruple-threat telling us to be BUYING this evening and going into tomorrow.
anchor chart. We can see a
quadruple-threat telling us to be BUYING this evening and going into tomorrow.
First, the long-term-trend
is clearly bullish. As I just mentioned,
we had 3 days this week where the opening-print was above the closing-print and
NEVER filled that ‘GAP.’
is clearly bullish. As I just mentioned,
we had 3 days this week where the opening-print was above the closing-print and
NEVER filled that ‘GAP.’
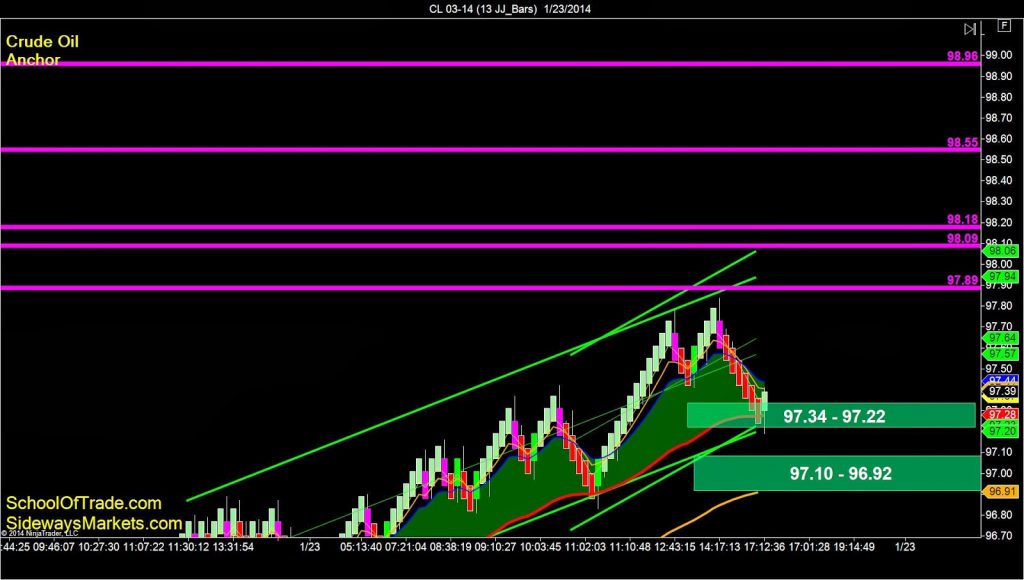 |
| Crude Oil Anchor 2 |
Second, the short-term trend is also bullish with recent higher-highs
and higher-lows in the price-action.
This tells us that even going into the closing-bell today we still have buying
opportunities in front of us for this evening.
and higher-lows in the price-action.
This tells us that even going into the closing-bell today we still have buying
opportunities in front of us for this evening.
Third, the ‘cloud’ is green, which means the short term
prices are moving higher ahead of the long term prices. In other words, we are more bullish in the
short term.
prices are moving higher ahead of the long term prices. In other words, we are more bullish in the
short term.
Fourth, we are above all the key moving-averages on this
anchor chart, which will all be acting as key-support this evening and into the
weekend.
anchor chart, which will all be acting as key-support this evening and into the
weekend.
All of these clues tell us that we can BUY whenever we see a wave-pattern
long this evening or tomorrow.
long this evening or tomorrow.
Gold:
VIP Chart:
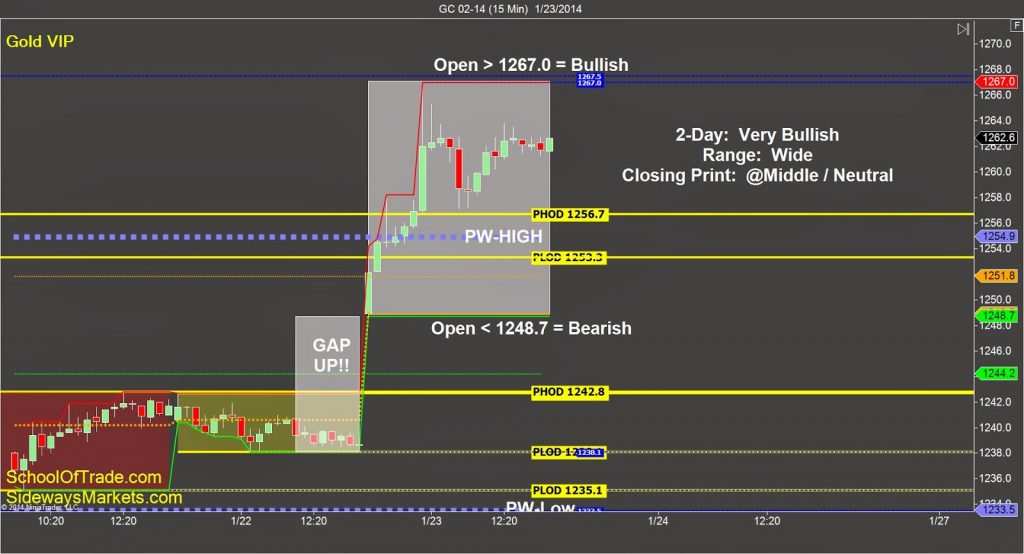
WOAH look at Gold! The
news from China in the middle of the night on Wednesday night shook the
confidence in the US economy and sent gold rocketing higher into Thursday’s
trading session.
 |
| Gold VIP |
Look closely at this VIP chart because there are some hidden
clues in the price-action on the chart.
clues in the price-action on the chart.
First, the multi-day relationship is very bullish with a huge
gap-up overnight that was never filled.
gap-up overnight that was never filled.
Second, a very wide trading-range tells us that tomorrow
(Friday w/out any news) is likely to be much slower and will usually be ‘range-bound’
and inside the range from Thursday.
Nothing is guaranteed, but when the price-action moves in a VERY wide
range, we usually see a much narrower range on the following day.
(Friday w/out any news) is likely to be much slower and will usually be ‘range-bound’
and inside the range from Thursday.
Nothing is guaranteed, but when the price-action moves in a VERY wide
range, we usually see a much narrower range on the following day.
Third, the closing-print gives us a BIG CLUE that this rally
higher may be very short-lived. We only
saw ONE news report from China that shook up this market-personality,
and it appears that the BIG candlestick
wicks and the closing-print in the MIDDLE tells us that these buyers weren’t very confident going into the closing-bell because we can easily see the buyers
stalled about half way up the range.
All of these clues tell us that tomorrow is likely to be a
much narrower trading-range type of day, and the buyers that pushed price
higher TODAY most likely took their profit at the closing-bell today and we are
very anxious to see if this price-action collapses back down tomorrow, or if
this bullishness continues into Friday!
much narrower trading-range type of day, and the buyers that pushed price
higher TODAY most likely took their profit at the closing-bell today and we are
very anxious to see if this price-action collapses back down tomorrow, or if
this bullishness continues into Friday!
Anchor Chart:
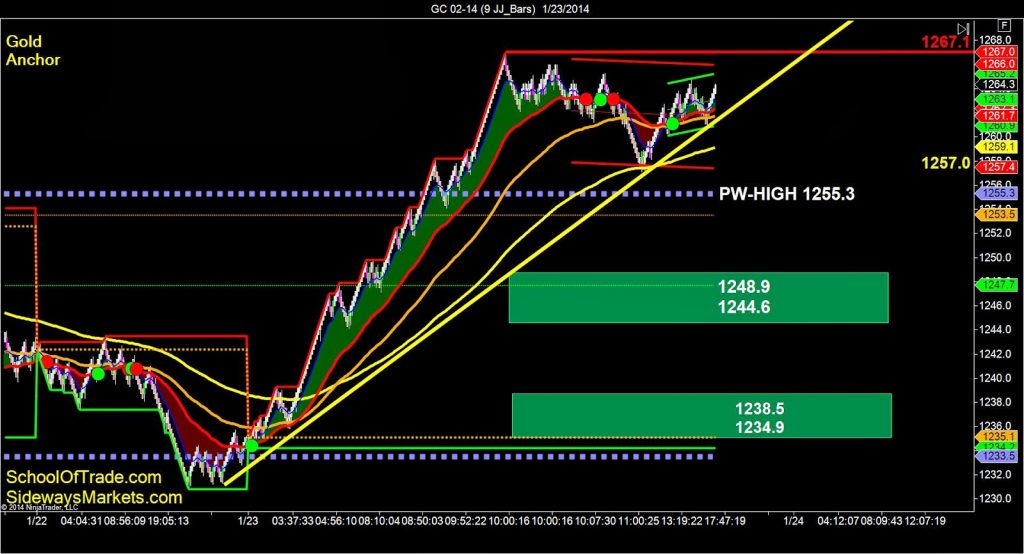
The Anchor chart on gold leaves the window WIDE OPEN for
anything to happen this evening and into Friday’s trading session.
anything to happen this evening and into Friday’s trading session.
 |
| Gold Anchor 1 |
We can see the sideways-trading-range
that has developed in the short term on this anchor chart. The long-term-trend is clearly bullish, but
we have seen this many times before; a single news event pushes prices higher,
and then there is no real demand for the commodity so the following day it
collapses back down on its own weight back to where it began.
 |
| Gold Anchor 2 |
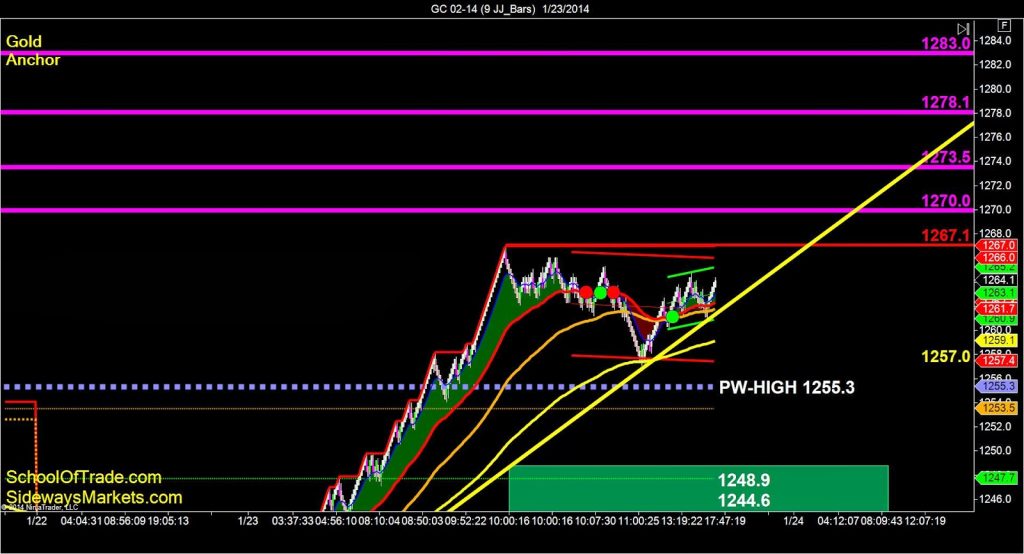
We can’t see any strong trend right now in the short-term on
this anchor
chart, so the most important thing on Gold is to prepare for all three
(3) possible scenarios.
this anchor
chart, so the most important thing on Gold is to prepare for all three
(3) possible scenarios.
Price-action can move higher, lower, or sideways so we want
to be prepared to capitalize on all directions that are possible for tomorrow.
to be prepared to capitalize on all directions that are possible for tomorrow.
Mini-Russell:
VIP Chart:
 |
| Mini Russell VIP |
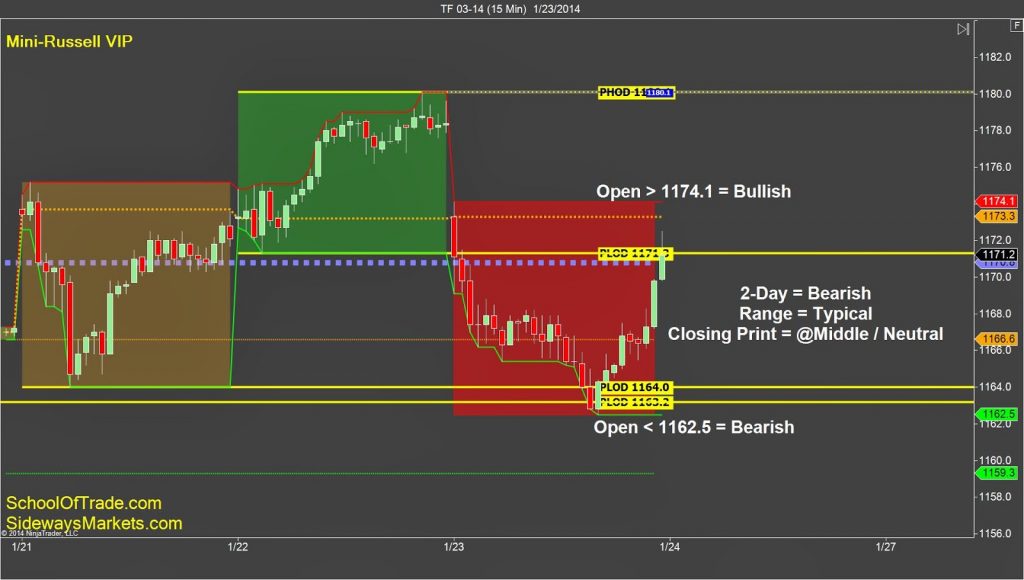
The Mini-Russell (as well as the other e-mini’s) took it on
the chin in Thursday’s trading session after news from China apparently spooked
everyone while pushing gold higher by $25.00 and equities falling to weekly
lows.
the chin in Thursday’s trading session after news from China apparently spooked
everyone while pushing gold higher by $25.00 and equities falling to weekly
lows.
Look very closely at this VIP chart and you can see some big
clues for tomorrow’s trading session.
clues for tomorrow’s trading session.
First, multi-day relationship is bearish with lower-lows
and lower-highs from 1 day to the next.
and lower-highs from 1 day to the next.
Second, we see a “short-covering rally” occurred as we
finished the trading session today.
finished the trading session today.
Third, the closing-print today was just a tick or two ABOVE
the prior week highs at 1170.8.
the prior week highs at 1170.8.
These three (3) clues, along with an intimate knowledge of
these markets, tells me that this move lower was likely to be very
short-lived.
these markets, tells me that this move lower was likely to be very
short-lived.
The big clue I see is the short-covering
rally going into the closing-bell, which tells us that these sellers were NOT
confident in their short positions to hold them overnight.
rally going into the closing-bell, which tells us that these sellers were NOT
confident in their short positions to hold them overnight.
Look closely and you can also see the closing-print today was
above the prior week’s highs, which is a HUGE bullish clue from this
chart. I think these sellers had some
fun today and tomorrow we will likely move back higher…but remember…trade what
you see on the chart…NOT what I think!
above the prior week’s highs, which is a HUGE bullish clue from this
chart. I think these sellers had some
fun today and tomorrow we will likely move back higher…but remember…trade what
you see on the chart…NOT what I think!
Anchor Chart:
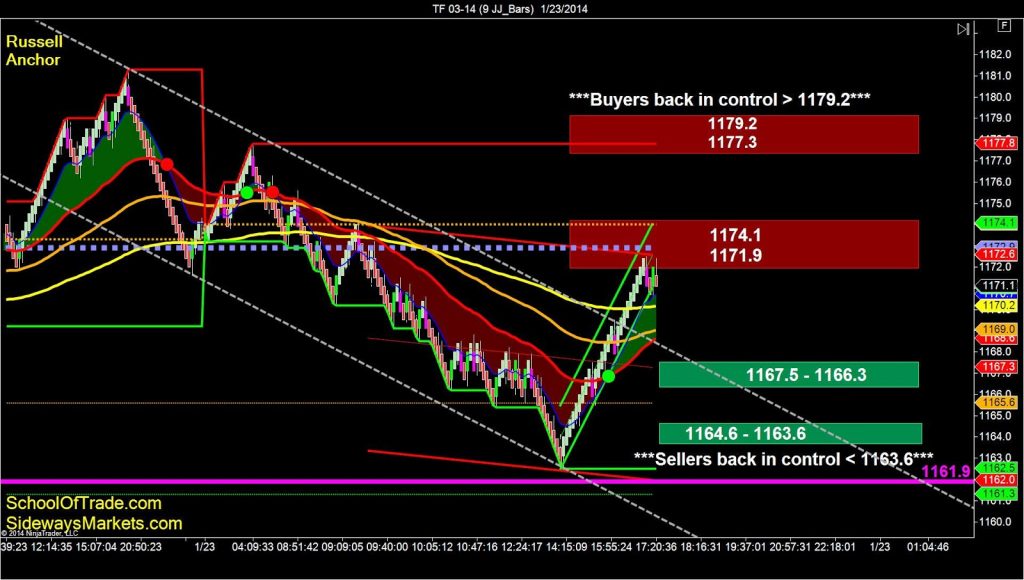 |
| Mini Russell Anchor |
The Mini-Russell anchor chart confirms for us that the
sellers HAD control, but right now they are about to LOSE control to the buyers
once again after a session where the bears had control from the beginning.
sellers HAD control, but right now they are about to LOSE control to the buyers
once again after a session where the bears had control from the beginning.
Looking at the anchor chart we see 2 sell-zones overhead at
1171.9 and 1177.3 which are both locations where we MAY see selling
opportunities this evening and tomorrow.
I am going to be looking at market-personality
tomorrow morning to see if these buyers are really taking control, and if they
ARE I will skip the sell-side and look for buying opportunities above the
1174.1 and then again above the 1179.2.
If price-action moves LOWER overnight I am looking to buy the
zone at 1167.5 and again at 1164.6.
zone at 1167.5 and again at 1164.6.
If price moves below the 1163.6 we can give up on the buyers
and resume selling once again like we saw this morning. I can assume that there are still plenty of
bulls in this market for tomorrow, which means I am going to try very hard to
get into a price-reversal
at these buy-zones below and try to get into the move going back higher (assuming
the buyers are there and we can find the entry pattern).
===========================================================
Want to see us trade LIVE?
Click here to register for the
Free Trial!
Click here to register for the
Free Trial!
Automated Trading Strategy; Let the
Computer do the trading
Computer do the trading
Are you a Crude Oil Trader? Click here to
trade Crude Oil
trade Crude Oil
Are you a Euro Trader? Click here to
trade Euro
trade Euro
Are you an E-Mini Russell Trader? Click here to trade
E-Mini Russell
E-Mini Russell
Are you a Gold Trader? Click here to trade
Gold
Gold
Join the Premier Live trade-room as an Advanced Member