- in Uncategorized by schooloftrade
Extreme Volatility gives day traders opportunity | SchoolOfTrade Newsletter 02/19/14

View this video on YouTube Here

down the wrong path in life…they don’t need motivation to speed up…they need
education to turn it all around.”
Today:
Last
Night:
Mini-Russell
BUY hits profit-target
Gold
trades sideways, sit-on-hands
Crude
Oil never pulls back, no trade
Today:
Crude
Oil; +133ticks (+0.33%) @ 102.95
Gold;
+141ticks (-0.80%) @ 1311.6
Mini-Russell;
+169ticks (-0.91%) @ 1148.1
Crude
Oil & Gold react to FOMC Minutes
Equities
testing all-time highs
News:
OPEX: Wacky Wednesday today
Housing
Starts: 16% drop M/M
FOMC
Minutes: Debate over Tapering
API#
for Crude Oil: -470k (1st
draw in 5 weeks)
This
Day In History
Feb
19th 1878: Thomas Edison receives patent
for “tin-foil talking phonograph”, known as the modern day record-player, was
first to record sounds.
Feb
19th 2008: Fidel
Castro resigns as President of Cuba after 49 years; his brother Raul succeeds him as president
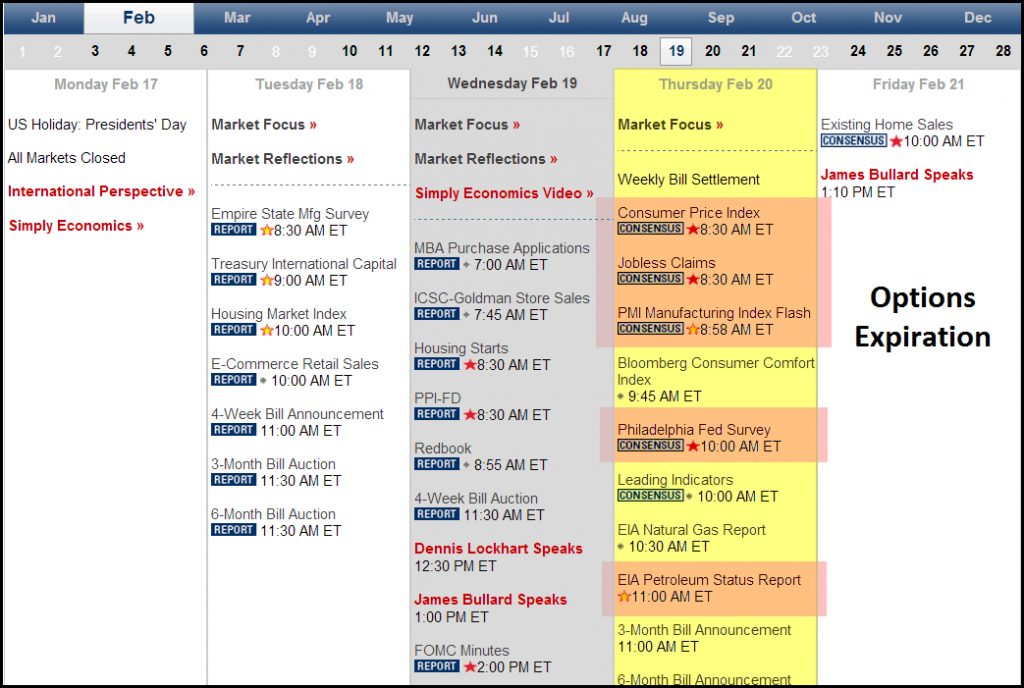
Tomorrow:
China: Manufacturing @ 8:45pm EST
Europe: Manufacturing @ 3:00am EST
US: Jobless Claims, Philly Fed Survey, Crude Oil Inventories
 |
| News for Tomorrow |
We have a very busy schedule of economic news going into
OPEX-Friday end of this week so we are excited to see more trading
opportunities starting this evening from China!
with manufacturing news from China at 8:45pm EST, followed by manufacturing news from
Europe tomorrow morning starting at 3:00am EST.
Who said you can’t trade the overnight session? You will have plenty of opportunities this
evening and into tomorrow morning.
US session we have more Red-Star News on the schedule starting with 8:30am EST Jobless Claims, and
then later in the morning we have the weekly Crude Oil Inventories report due
out at 11:00am EST.
inside of OPEX week,
and tomorrow is Thursday so we must be aware that volume will be a bit inconsistent
as traders prepare for OPEX on Friday.
trading Crude Oil tomorrow you need to be patient to wait around 11:00am EST when they release the
weekly Inventories. I recommend our
students to sit-on-hands 15-minutes before and after the news comes out, and to
stay patient waiting for the new ‘direction’ after 11:00am EST.
8:30am
EST: Jobless
Claims | Consumer
Price Index
8:58am
EST: PMI
Manufacturing Index
10:00am
EST: Philly
Fed Survey
10:30am
EST: Natural
Gas Inventories
11:00am
EST: Crude
Oil Inventories

Crude Oil traded higher for the 3rd day in a row
today, ending the session right up at the highs near the big-round-number of
103.00. One big clue we see on this
chart is the volume, which is near the middle to lows of today’s range,
suggesting that something surprised the markets late in the session today and
pushed the price-action to the highs.
to look for buying opportunities above the 103.05, and selling opportunities below
the 102.11. If we can get short tomorrow
morning our profit-target is below at the prior week high at 101.09.
 |
| Crude Oil 34 Anchor |
Crude Oil is pushing hard into major overhead resistance this
evening on the 34-anchor chart. We can
see a sell-zone from 104.34 down to 101.81 and it appears that Crude Oil has
pierced the lower end of the range and is trying to test the highs at 104.34 or
105.01 overhead.
 |
| Crude Oil 21-Anchor |
The 21-anchor chart of Crude Oil shows us trading in
over-bought territory, priced at a significant premium, which means we have to
wait patiently for price to pullback off these highs if we are going to get a
chance to buy this bullish market this evening or tomorrow. I’m looking to buy the 101.22 if price-action
can get back to the lows of this bullish price channel.
 |
| Crude Oil 13-Anchor |
The 13-anchor chart of Crude Oil shows us the most important
information this evening that we can use to make profit. We can see this short-term bullish price
channel along with 2 buy-zones at 102.63 and 102.24.
evening and tomorrow is to buy the 102.63 and 102.24 looking for a profit-target
up at the highs around 103.28 and 103.59.
If we push below the 102.11 I am selling short down to 101.09.
 |
| Gold VIP Chart |
Gold traded inside the range from yesterday for a second day
in a row today, suggesting that something BIG is likely on the horizon for Gold
traders. Today we had a very narrow trading-range
and volume in the middle of the range, suggesting that a larger trading-range is
likely to come before the end of the week.
is to look for buying opportunities above the 1324.7 and selling opportunities below
the 1317.0 with a profit-target down at the 1300.0 big-round-number below us.
 |
| Gold 34-Anchor |
It’s no wonder WHY Gold tumbled off the highs in today’s
trading session…after running into major resistance at 1328.6 on the 34-anchor
chart as well as hearing from the FOMC Meeting Minutes that they MAY stall the
tapering in the US in the coming months if this economic data doesn’t improve.
 |
| Gold 21-Anchor |
The 21-anchor chart of Gold tells us a very important
story. We can see that price-action is
well over-bought this evening at the highs of the bullish price channel and now
starting to show signs of weakness to head lower this evening and into
tomorrow. If you look closely you can
see that there is only 1 support level holding this price-action up at the
highs. If we can get below the 1309.0
area we should be able to get short very easily tomorrow.
 |
| Gold 13-Anchor |
The 13-anchor chart of Gold provides us with the most useful
information for day trading this evening.
We can see this short term bear price channel has developed, and we are
making new lower-lows and lower-highs on the way off the recent highs at
1130.0.
sell the resistance levels overhead at 1315.7, 1317.2, 1319.5 and 1320.9 with a
profit-target below us at 1305.3, 1300.0, and 1292.9.
 |
| Russell VIP Chart |
The Mini-Russell went on a roller-coaster ride in today’s
trading session, moving to the highs, and then collapsing back down to the
lows. We ALMOST made it back below the
prior week’s highs at 1146.8 but the buyers were able to keep us above it.
tomorrow is to sell short below the 1145.7, and looking for buying
opportunities above the 1162.6. Inside
the range I will buy the lows and sell the highs, avoiding the middle of the
range.
 |
| Russell 34-Anchor |
The 34-anchor chart of the Mini-Russell shows us some very
big clues this evening, including a price wedge on this slow anchor chart with resistance
above around 1165.0 and major support below us around 1100.0. This price wedge and resistance at 1159.2
suggests that we may be moving lower into the end of the week.
 |
| Russell 21-Anchor |
The 21-anchor chart of the Mini-Russell paints a very bullish
picture, however we can see the lows of this bullish price channel may be the
last-resort for the buyers to keep this price-action at these highs. If we break the lows of the price channel we
still have to make it through the support at 1139.8 and then it’s FREE FALLING
down to 1120.3.
 |
| Russell 13-Anchor |
The 13-anchor chart of the Mini-Russell shows us some easy
opportunities to sell the highs of this price wedge we found on the 34-anchor
chart this evening. We can see that price-action
is stuck at the prior week’s high of 1148.9 and a support zone at 1147.3, but
we have some great selling opportunities at the zones at 1152.2, 1153.7,
1155.8, and 1157.1.
is to sell short at 1152.2 or 1155.8 and use the levels below me as profit-targets
around 1147.3, 1144.0, 1140.9 and 1135.8.
Click here to register for the
Free Trial!
Computer do the trading
trade Crude Oil
trade Euro
E-Mini Russell
Gold