January 29, 2014
- in Uncategorized by schooloftrade
5 Clues from today’s Dovish FOMC Report | SchoolOfTrade Nightly-Newsletter

“Take the first step in faith. You don’t have to see the whole staircase,
just take the first step” – Dr. Martin Luther
King Jr.
Reflections from Today:
·
Tuesday
night Turkey, South Africa and India raised rates twice as much as expected,
causing the equities to drop overnight over growth concerns
Tuesday
night Turkey, South Africa and India raised rates twice as much as expected,
causing the equities to drop overnight over growth concerns
·
Final
FOMC Day with Ben ‘Helicopter’ Bernanke.
February 1 sees Janet Yellen taking over the reins at the Fed
Final
FOMC Day with Ben ‘Helicopter’ Bernanke.
February 1 sees Janet Yellen taking over the reins at the Fed
·
Today’s
FOMC Announcement: Very optimistic outlook, Fed to maintain its current pace of
tapering ($10B) extended into the future
Today’s
FOMC Announcement: Very optimistic outlook, Fed to maintain its current pace of
tapering ($10B) extended into the future
·
FOMC: Economy continues to expand, recent jobs
report was weak, household spending is strong, unemployment rate is still too
high.
FOMC: Economy continues to expand, recent jobs
report was weak, household spending is strong, unemployment rate is still too
high.
·
FOMC: Very Dovish, rates will stay low, tapering
most likely to continue with consistency.
FOMC: Very Dovish, rates will stay low, tapering
most likely to continue with consistency.
·
Gold
reacted by moving higher over concerns that tapering will affect emerging
markets
Gold
reacted by moving higher over concerns that tapering will affect emerging
markets
·
Crude
Oil pushed higher to last week’s highs (+.30% @ 97.47)
Crude
Oil pushed higher to last week’s highs (+.30% @ 97.47)
·
Gold
opened “gap-up” and never looked back (+.96% @ 1267.6)
Gold
opened “gap-up” and never looked back (+.96% @ 1267.6)
·
Mini-Russell
got crushed today, ending down (-1.95% @ 1120.3)
Mini-Russell
got crushed today, ending down (-1.95% @ 1120.3)
·
Jobless
Claims & GDP on Thursday @ 8:30am EST
Jobless
Claims & GDP on Thursday @ 8:30am EST
·
Gold
contract rollover on Friday 31st
Gold
contract rollover on Friday 31st
·
Chinese
New Year on Friday 31st
Chinese
New Year on Friday 31st
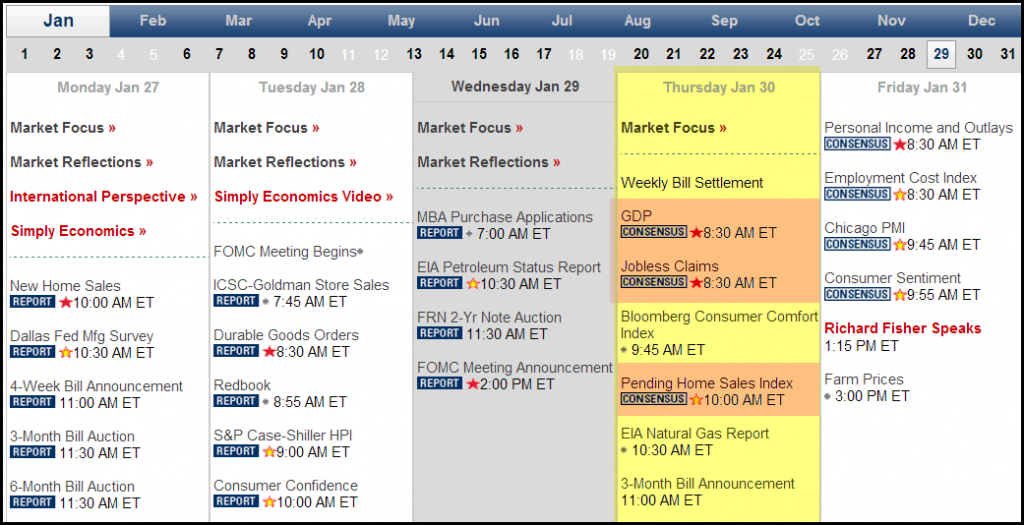
Economic News for Tomorrow:
We have a
lot more important news to trade with on Thursday morning, so we are expecting
ANOTHER exciting trading session tomorrow with Jobless Claims and GDP scheduled
at 8:30am EST.
lot more important news to trade with on Thursday morning, so we are expecting
ANOTHER exciting trading session tomorrow with Jobless Claims and GDP scheduled
at 8:30am EST.
Tomorrow’s
GDP will tell us how strong the fourth quarter was in 2013, and this is one of
the last reports we are going to see from 2013. Jobless Claims will tell us how the
employment situation is looking here in the US and later tomorrow we hear from
Pending Home Sales which will give us a glimpse into the future of the housing
market.
Thursday’s
ALWAYS seem to be great trading sessions, and we will be ready to react to
these news events starting early in the tomorrow’s session.
ALWAYS seem to be great trading sessions, and we will be ready to react to
these news events starting early in the tomorrow’s session.
8:30am EST: Jobless
Claims & GDP
Claims & GDP
10:00am EST: Pending
Home Sales
Home Sales
Day trading plan for Tomorrow:
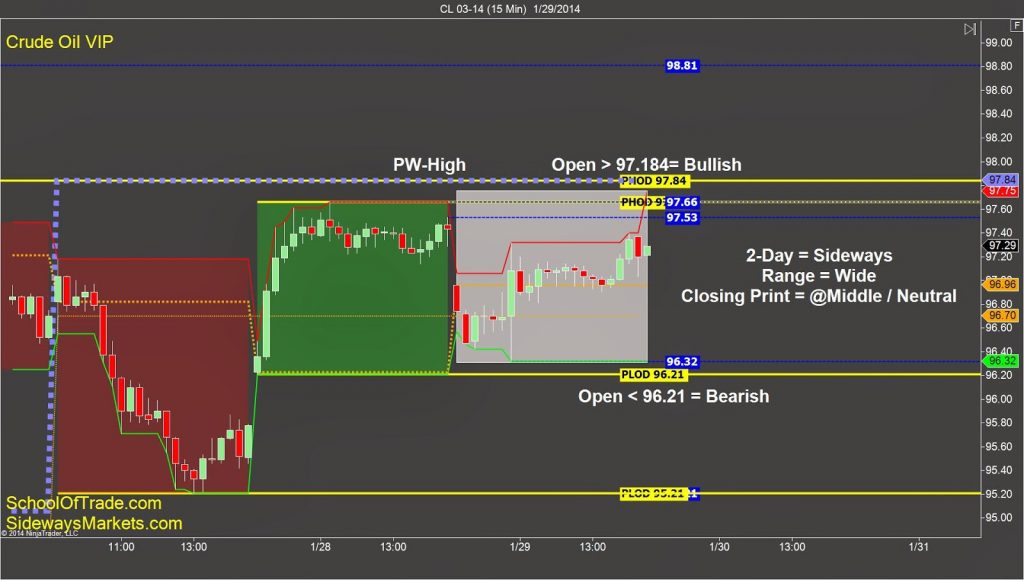
Crude Oil:
VIP Chart:
 |
| Crude Oil VIP Chart |
Crude Oil looks very ‘balanced’ this evening on our VIP
chart. We can see a sideways 2-day
relationship, a typical trading-range and a closing-print right in the middle
of the range from today. All of these
clues tell us that tomorrow’s opening-print will be the key to know which
direction we will be headed into Thursday’s session.
chart. We can see a sideways 2-day
relationship, a typical trading-range and a closing-print right in the middle
of the range from today. All of these
clues tell us that tomorrow’s opening-print will be the key to know which
direction we will be headed into Thursday’s session.
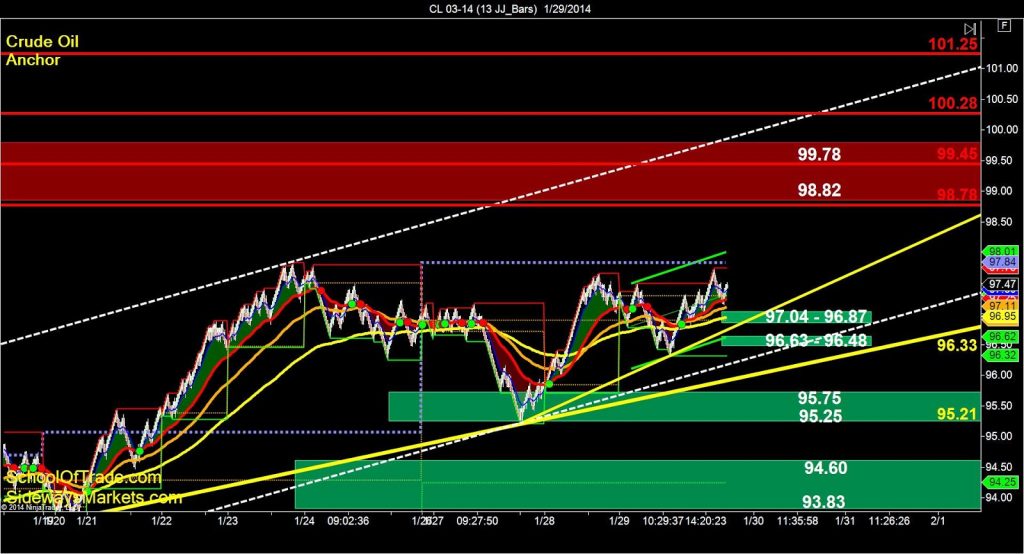
Anchor Chart:
 |
| Crude Oil Anchor Chart 1 |
Crude Oil is looking very BULLISH on the anchor chart this
evening. We can see price-action is
currently above the key moving-averages and we have some easy buying
opportunities below us at 97.04 and 96.63.
evening. We can see price-action is
currently above the key moving-averages and we have some easy buying
opportunities below us at 97.04 and 96.63.
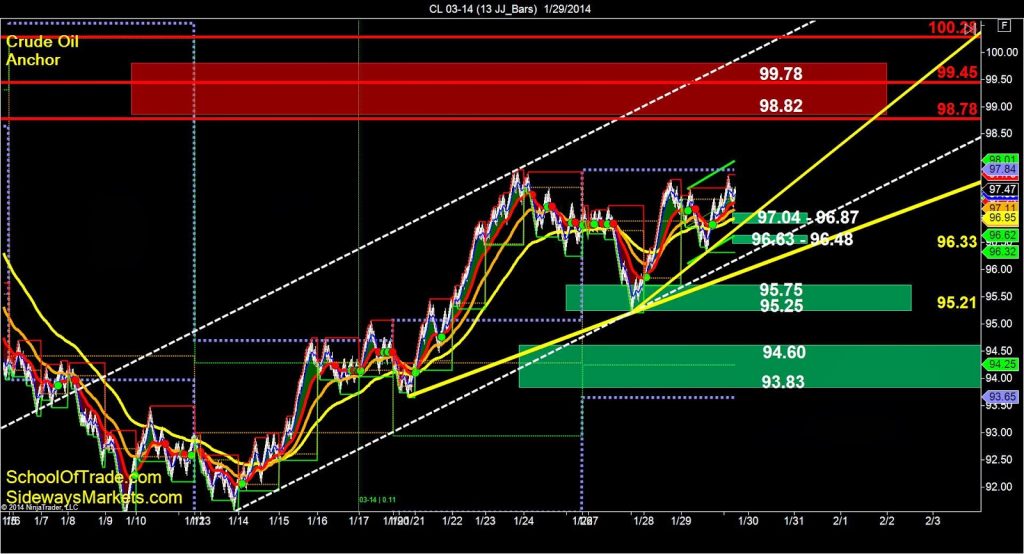 |
| Crude Oil Anchor Chart 2 |
I am looking to buy Crude Oil this evening and into tomorrow
using our simple wave-pattern long entry and will look for a profit-target at
98.78 overhead.
using our simple wave-pattern long entry and will look for a profit-target at
98.78 overhead.
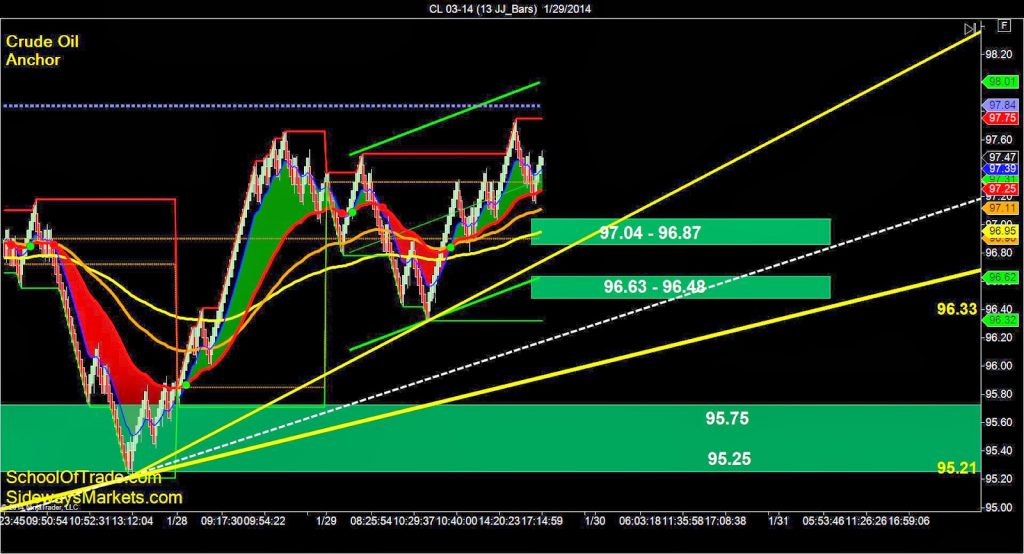 |
| Crude Oil Anchor Chart 3 |
We can see the long term bullish price channel on the anchor
chart is going to give us a nice profit-target up around the 100.00, which is
possibly foreshadowing a move into the end of the week back up to the big-round-number
at 100.00.
chart is going to give us a nice profit-target up around the 100.00, which is
possibly foreshadowing a move into the end of the week back up to the big-round-number
at 100.00.
Gold:
VIP Chart:
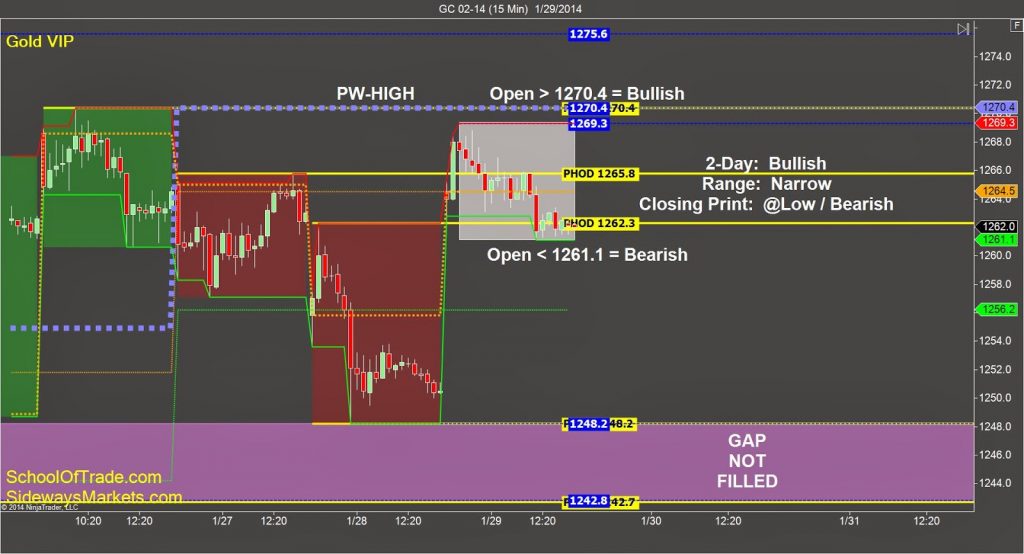 |
| Gold VIP Chart |
Gold is giving us some very mixed-signals on the VIP chart
this evening, and we expect to see a LOT of volatility in tomorrow’s trading
session because of today’s very bullish FOMC announcement.
this evening, and we expect to see a LOT of volatility in tomorrow’s trading
session because of today’s very bullish FOMC announcement.
First, we see a big GAP UP overnight, which told us the
buyers were in clear control going from London to New York this morning.
buyers were in clear control going from London to New York this morning.
Second, we can see that the buying wasn’t sustained for very
long into the US session and the price-action pulled off the highs at 1269.3
and collapsed back to the PHOD at 1262.3.
long into the US session and the price-action pulled off the highs at 1269.3
and collapsed back to the PHOD at 1262.3.
Third, we see a very narrow trading-range from the US session
today, suggesting that tomorrow has the potential to be very wide range and
volatile.
today, suggesting that tomorrow has the potential to be very wide range and
volatile.
The narrow trading-range, gap-up, and collapse back to the PHOD
are telling us that tomorrow is likely going to be a volatile trading session
that could go anywhere!
are telling us that tomorrow is likely going to be a volatile trading session
that could go anywhere!
Anchor Chart:
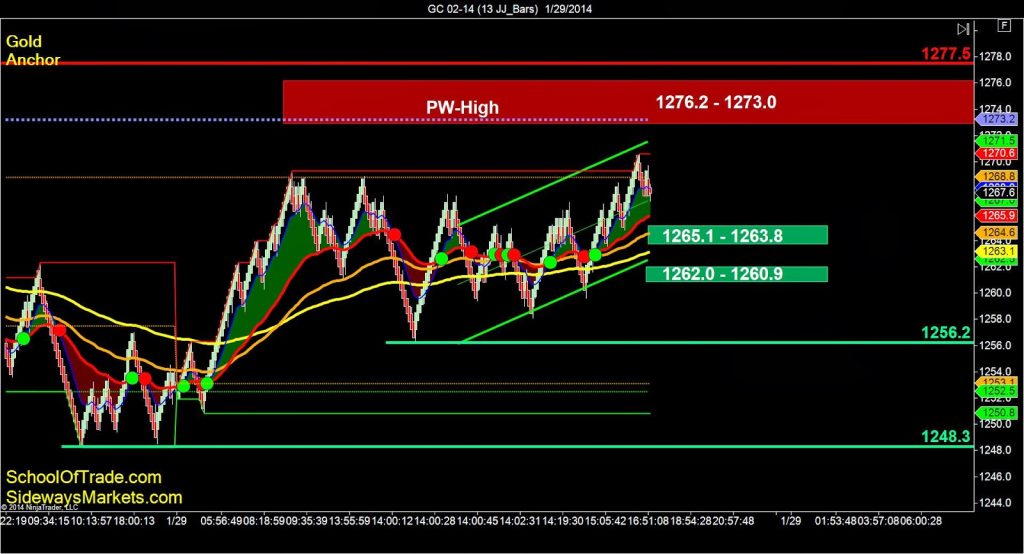 |
| Gold Anchor Chart 1 |
The Anchor chart of Gold paints a very bullish picture this
evening. We can see a recent higher-high
with higher-lows on the way up. We have
all the key moving-averages below us right now so we have the green light to
get LONG.
evening. We can see a recent higher-high
with higher-lows on the way up. We have
all the key moving-averages below us right now so we have the green light to
get LONG.
 |
| Gold Anchor Chart 2 |
My perfect entry will be to buy the 1265.1 or 1262.0 with a profit-target
up at the highs at 1270.6 and then 1273.2.
up at the highs at 1270.6 and then 1273.2.
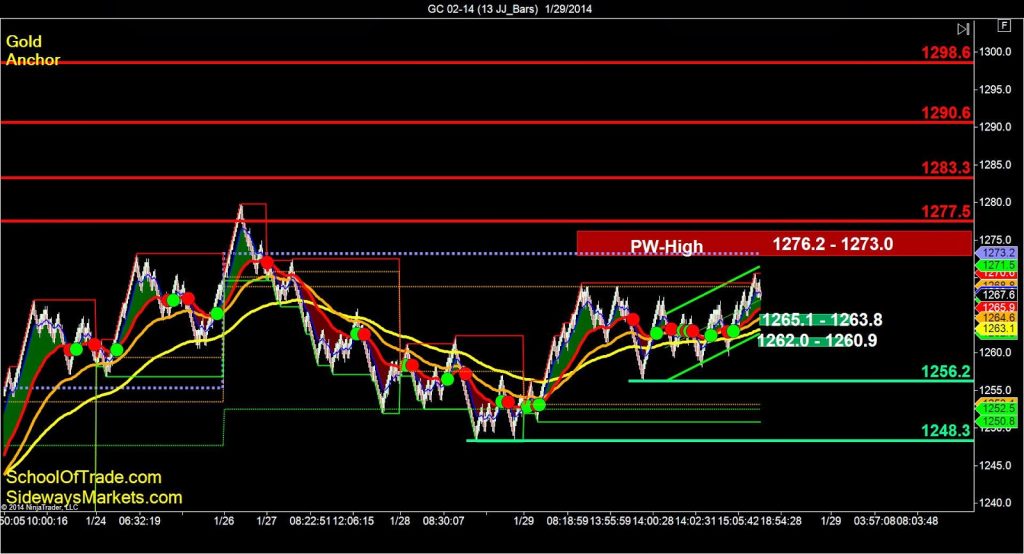
Gold may take off higher tomorrow morning, so we have some profit-targets
overhead that we will use for our long positions starting with 1276.2, 1277.5,
1283.3 and 1290.6.
overhead that we will use for our long positions starting with 1276.2, 1277.5,
1283.3 and 1290.6.
Mini-Russell:
VIP Chart:
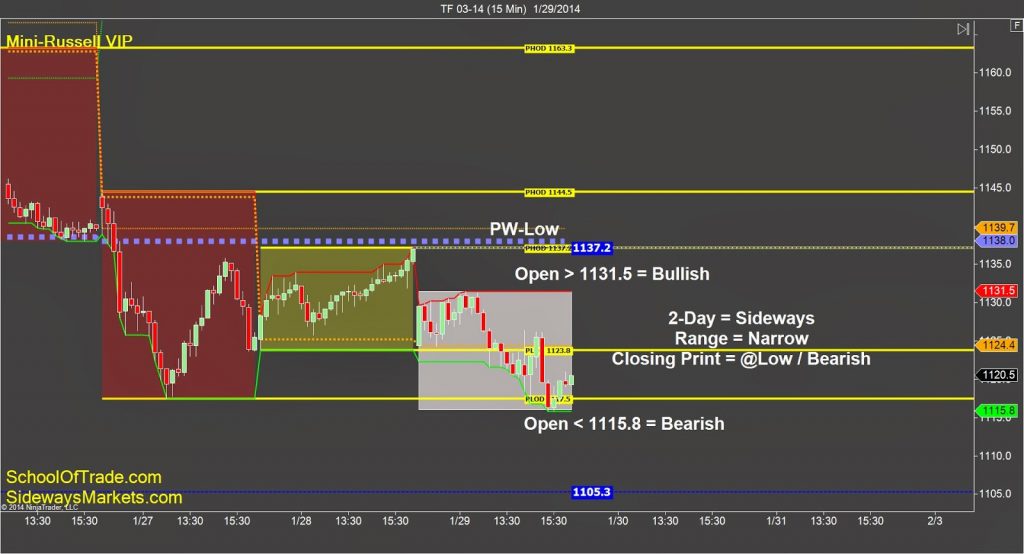 |
| Russell VIP Chart |
The Mini-Russell, along with the other e-mini, got pushed lower
today after the European equities began to selloff after India, Turkey and
South Africa raised their interest rates in a surprise meeting of their Fed
banks.
The VIP chart isn’t making it very easy on us going into
tomorrow. We have a sideways 2-day
relationship, a very narrow trading-range, and a closing-print at the
lows.
tomorrow. We have a sideways 2-day
relationship, a very narrow trading-range, and a closing-print at the
lows.
This narrow trading-range tells us that SOMETHING big is
coming soon, possibly tomorrow or Friday, but this selloff today shows us that
ANYTHING is possible right now.
coming soon, possibly tomorrow or Friday, but this selloff today shows us that
ANYTHING is possible right now.
The closing-print at the lows of the range today leads us to
believe there are more bears than bulls in the equities right now, but that’s
the opposite of what we thought last night.
A wise trader at this point won’t try to predict tomorrow, we will
simple come back in the morning and look at where the opening-bell leads us.
believe there are more bears than bulls in the equities right now, but that’s
the opposite of what we thought last night.
A wise trader at this point won’t try to predict tomorrow, we will
simple come back in the morning and look at where the opening-bell leads us.
Anchor Chart:
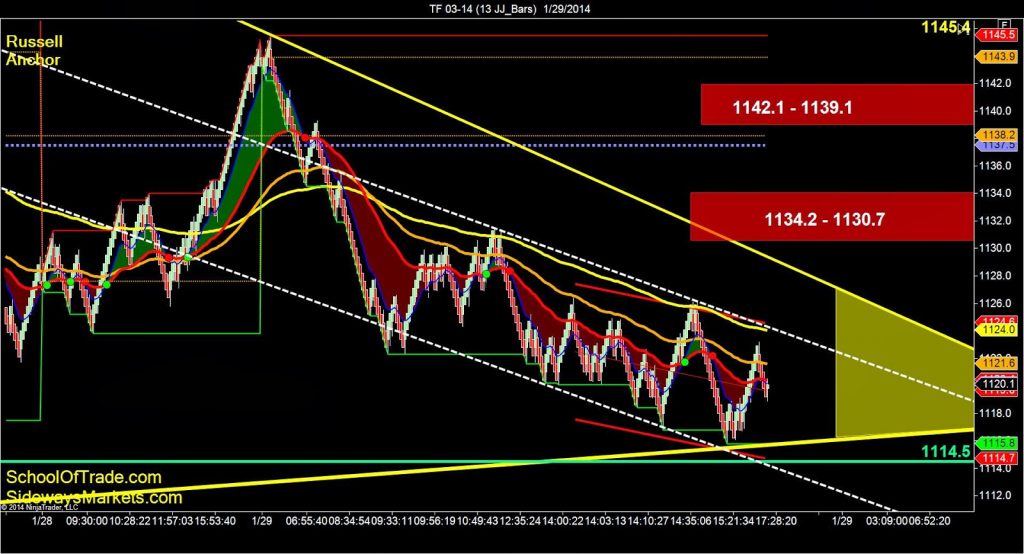 |
| Russell Anchor Chart 1 |
The anchor chart looks very bearish on the Mini-Russell;
however, we don’t have a lot of wide-open-space to trade into at this time.
however, we don’t have a lot of wide-open-space to trade into at this time.
We can see a bearish trend, we are below the key moving-averages
and we’re making new lower-lows and lower-highs.
and we’re making new lower-lows and lower-highs.
The only problem we can see is this major trend-line as support
below us around the 1114.5 level. This trend-line
goes all the way back to last November and it will likely provide some support to
spoil the party for the sellers.
below us around the 1114.5 level. This trend-line
goes all the way back to last November and it will likely provide some support to
spoil the party for the sellers.
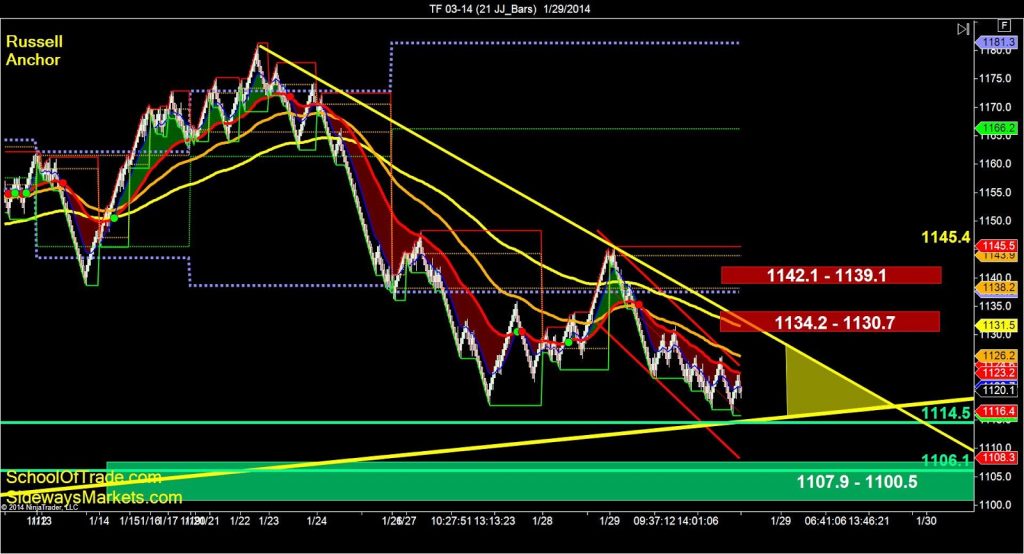 |
| Russell Anchor Chart 2 |
My goal is to sell at resistance levels overhead so that I’m
selling at a premium, so I will stay patient to sell the 1134.2 or 1142.1 and I
will avoid selling the lows or directly into the support around 1114.5.
selling at a premium, so I will stay patient to sell the 1134.2 or 1142.1 and I
will avoid selling the lows or directly into the support around 1114.5.
===========================================================
Want to see us trade LIVE?
Click here to register for the
Free Trial!
Click here to register for the
Free Trial!
Automated Trading Strategy; Let the
Computer do the trading
Computer do the trading
Are you a Crude Oil Trader? Click here to
trade Crude Oil
trade Crude Oil
Are you a Euro Trader? Click here to
trade Euro
trade Euro
Are you an E-Mini Russell Trader? Click here to trade
E-Mini Russell
E-Mini Russell
Are you a Gold Trader? Click here to trade
Gold
Gold
Join the Premier Live trade-room as an Advanced Member