July 27, 2012
- in Uncategorized by schooloftrade
Dollar Index Technical analysis prep

Dollar Index Checklist:
Heat Map: What is it
telling us?
telling us?
 We do not use the dollar index correlation below 0.3% and
today we are outside of our tolerance.
This may change, but as of 830am EST the dollar index has no market
personality and we will not use the correlation until it changes.
OHLC Analysis:
Everything is lower-lows so we are bearish this morning.
Overnight Highs & Lows:
We are testing and trying to break Thursday’s LOD, which
means if we go below it this dollar index is very bearish, and if we stay above
it, we can assume the buyers see value in higher prices and this dollar index
will likely attempt to test the highs.
means if we go below it this dollar index is very bearish, and if we stay above
it, we can assume the buyers see value in higher prices and this dollar index
will likely attempt to test the highs.
Are we inside or outside day today?
We are inside the range from Thursday, we have recently
attempted to move outside day < PLOD however the support looks like it will
hold.
attempted to move outside day < PLOD however the support looks like it will
hold.
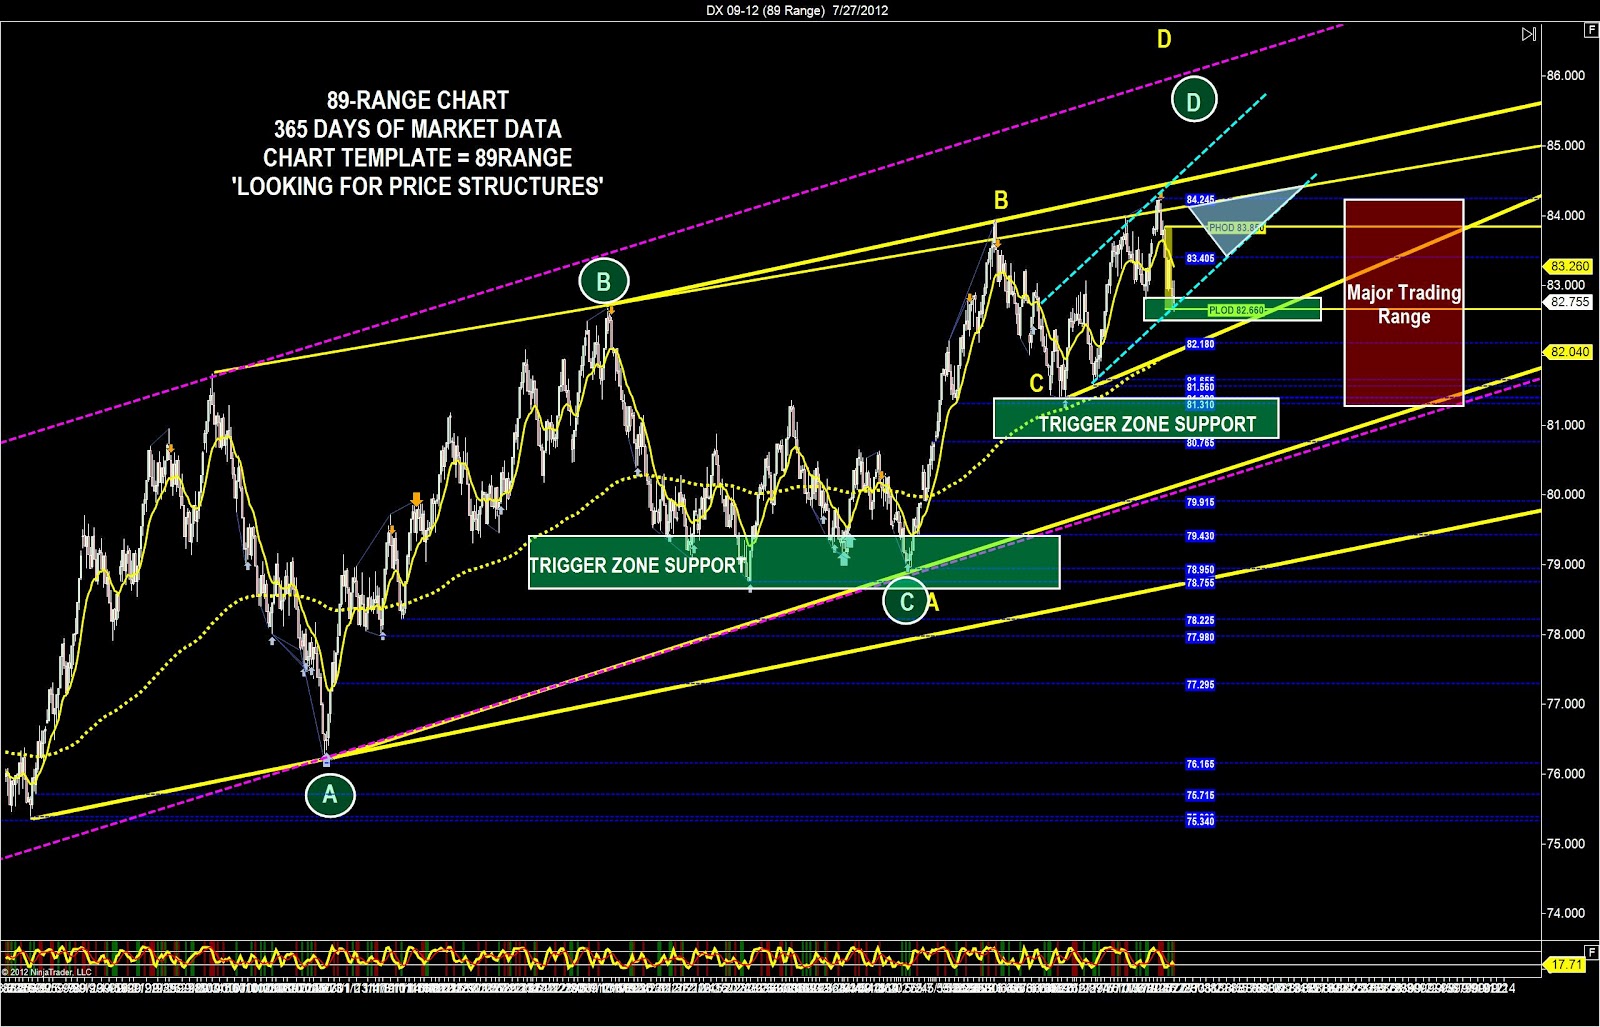
What price-structures do we see?
·
Price
wedge
Price
wedge
·
Price
channel is found on both the 89range the 21-range charts. 89range is bullish and 21range is bearish.
Price
channel is found on both the 89range the 21-range charts. 89range is bullish and 21range is bearish.
·
Trigger-zone
is directly below us and will act as support.
Trigger-zone
is directly below us and will act as support.
·
AB=CD
Pattern is setting up as we speak whenever price tests and holds in a trigger-zone,
which we have at 82.660 area.
AB=CD
Pattern is setting up as we speak whenever price tests and holds in a trigger-zone,
which we have at 82.660 area.
·
Zigzag
will be found on a faster timeframe, not our slower stuff.
Zigzag
will be found on a faster timeframe, not our slower stuff.
·
Double-top
/ Double-bottom none on this chart today
Double-top
/ Double-bottom none on this chart today
·
Range
Highs and Lows we are in the middle of right now. We can see the RED BOX marks the trading
range, and we are in the middle of that range.
Range
Highs and Lows we are in the middle of right now. We can see the RED BOX marks the trading
range, and we are in the middle of that range.
Where will a reversal be likely today?
The most likely price-reversal location is where we are at
the moment, sitting on trigger-zone support, the lows of the short term bull price
channel, and on top of PLOD. All of
these are support until broken with strength.
the moment, sitting on trigger-zone support, the lows of the short term bull price
channel, and on top of PLOD. All of
these are support until broken with strength.