- in Uncategorized by schooloftrade
Dollar index day trading strategy

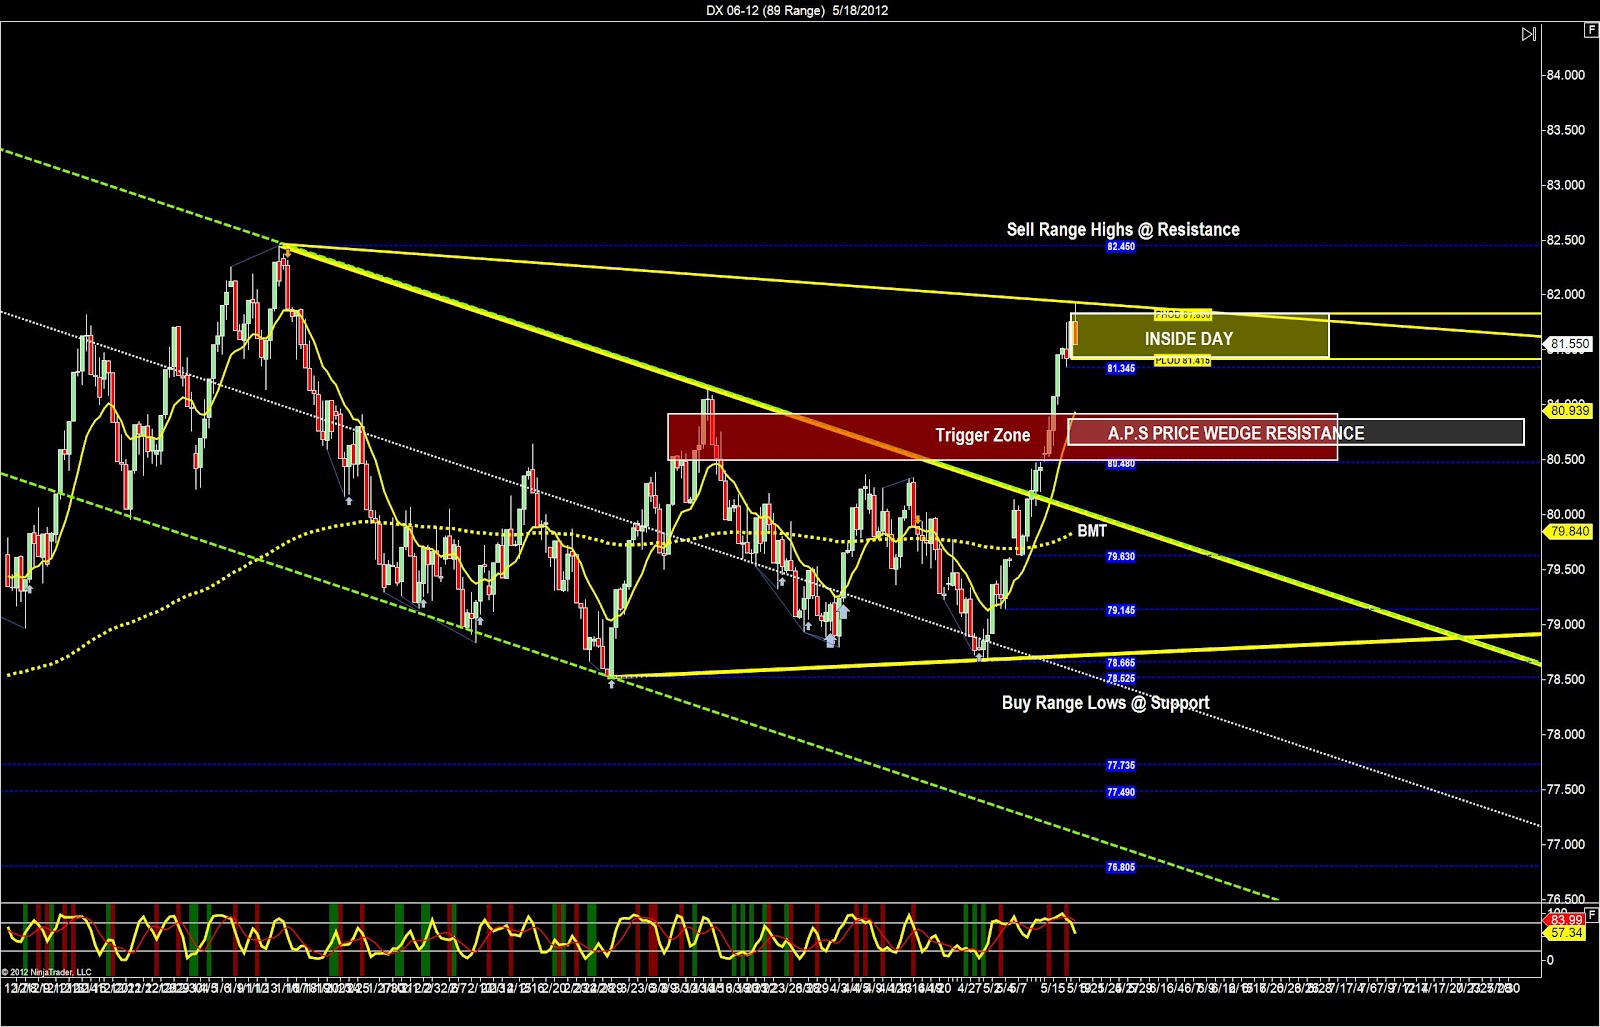 The dollar index has been trading
higher this morning and now we’re sitting at range highs and looking for a
reversal this morning on OPEX Friday. We
used a double-bottom to find overhead resistance and we can see this strong move
that the dollar index has made is not trending sideways, with an inside trading
day, and it just FEELS like this market is getting ready to reverses.
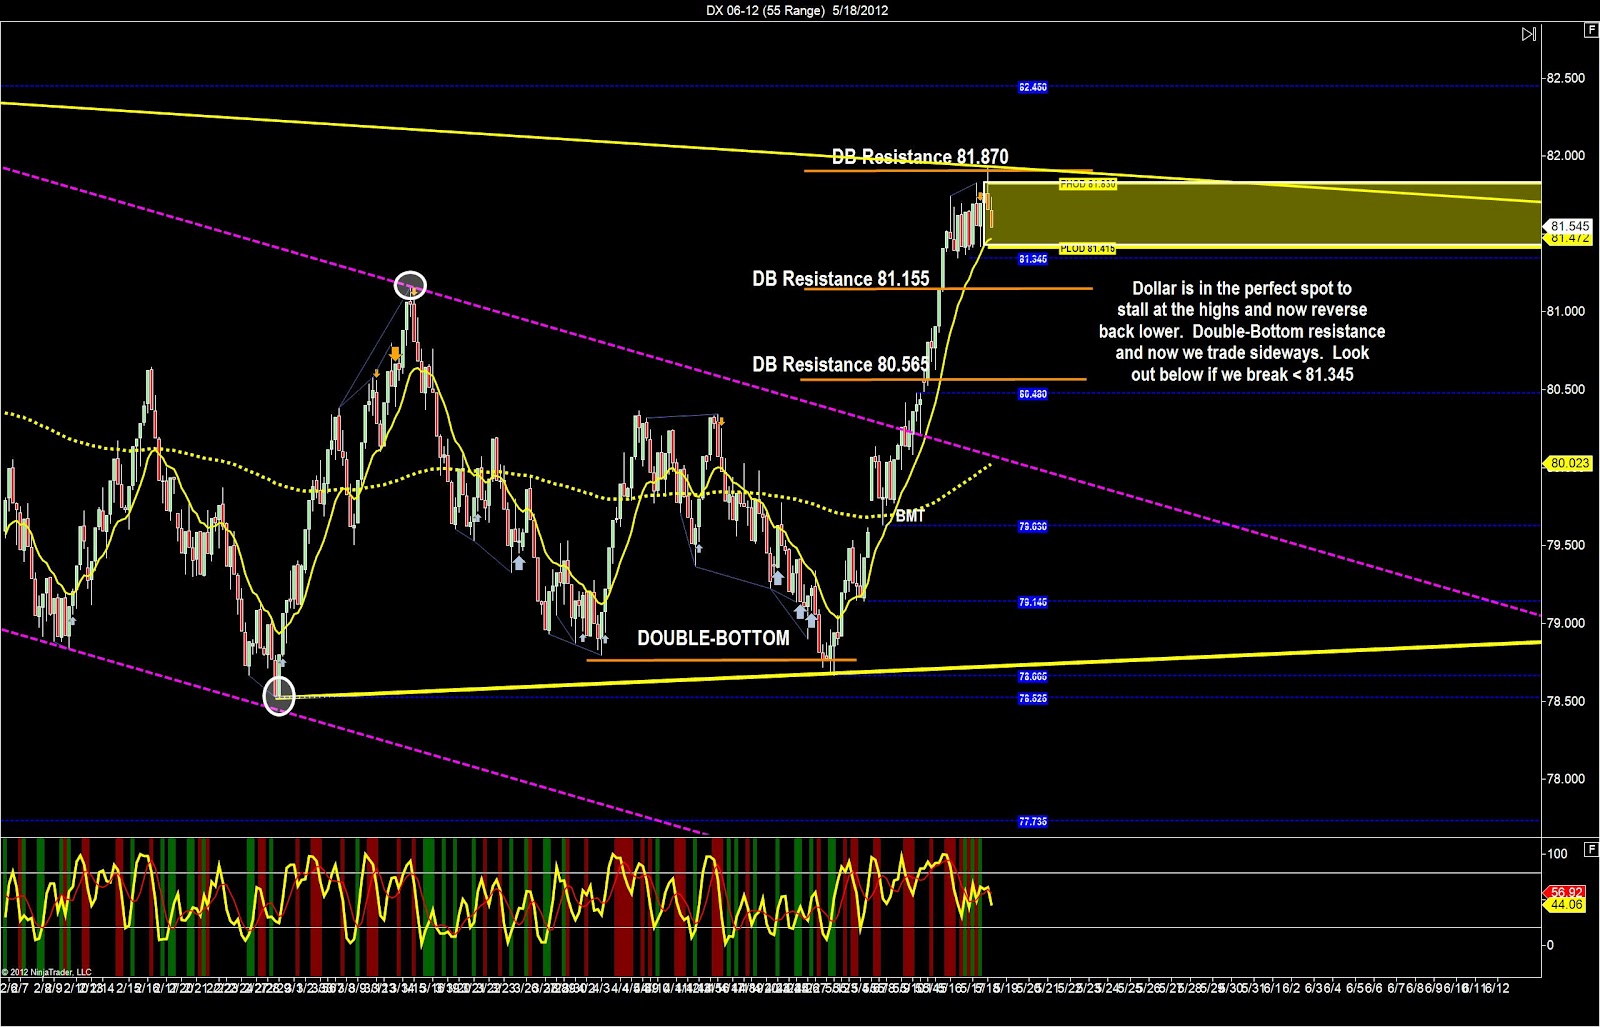
The 21-range chart shows us the recent strong
bull price channel in blue, and then the more recent almost-sideways bull price
channel in pink. You can see the PHOD is
above us, and the PLOD is below us, so we’re considered INSIDE DAY, which means
another big clue that the buyers did not feel this price was too expensive.

lower in the short term down to the support at the price channel lows and the PLOD. When we test the 81.415 and 81.345 support we
have 3 scenarios to consider. First,
price may bounce off support and rise back higher to the top of the price
channel. Second, the price may stall and
sit flat and sideways on the lows.
Third, the price may go right through this support at 81.345 is the last
line in the sand before the buyers fail, the sellers grab hold, and we start
the reversal.
We’re using multiple timeframes on the dollar
index to spot major resistance and the potential reversal on the 89 and 55
range charts. With that information
known, we then use the 21 range chart (faster) to find the exact place where
the reversal will occur, and this location is the 81.345 support. If we stay above this price level we will
trade sideways and if we go below this level the blood is in the water, and the
price will see selling pressure to push it back down to 80.480.