July 24, 2012
- in Uncategorized by schooloftrade
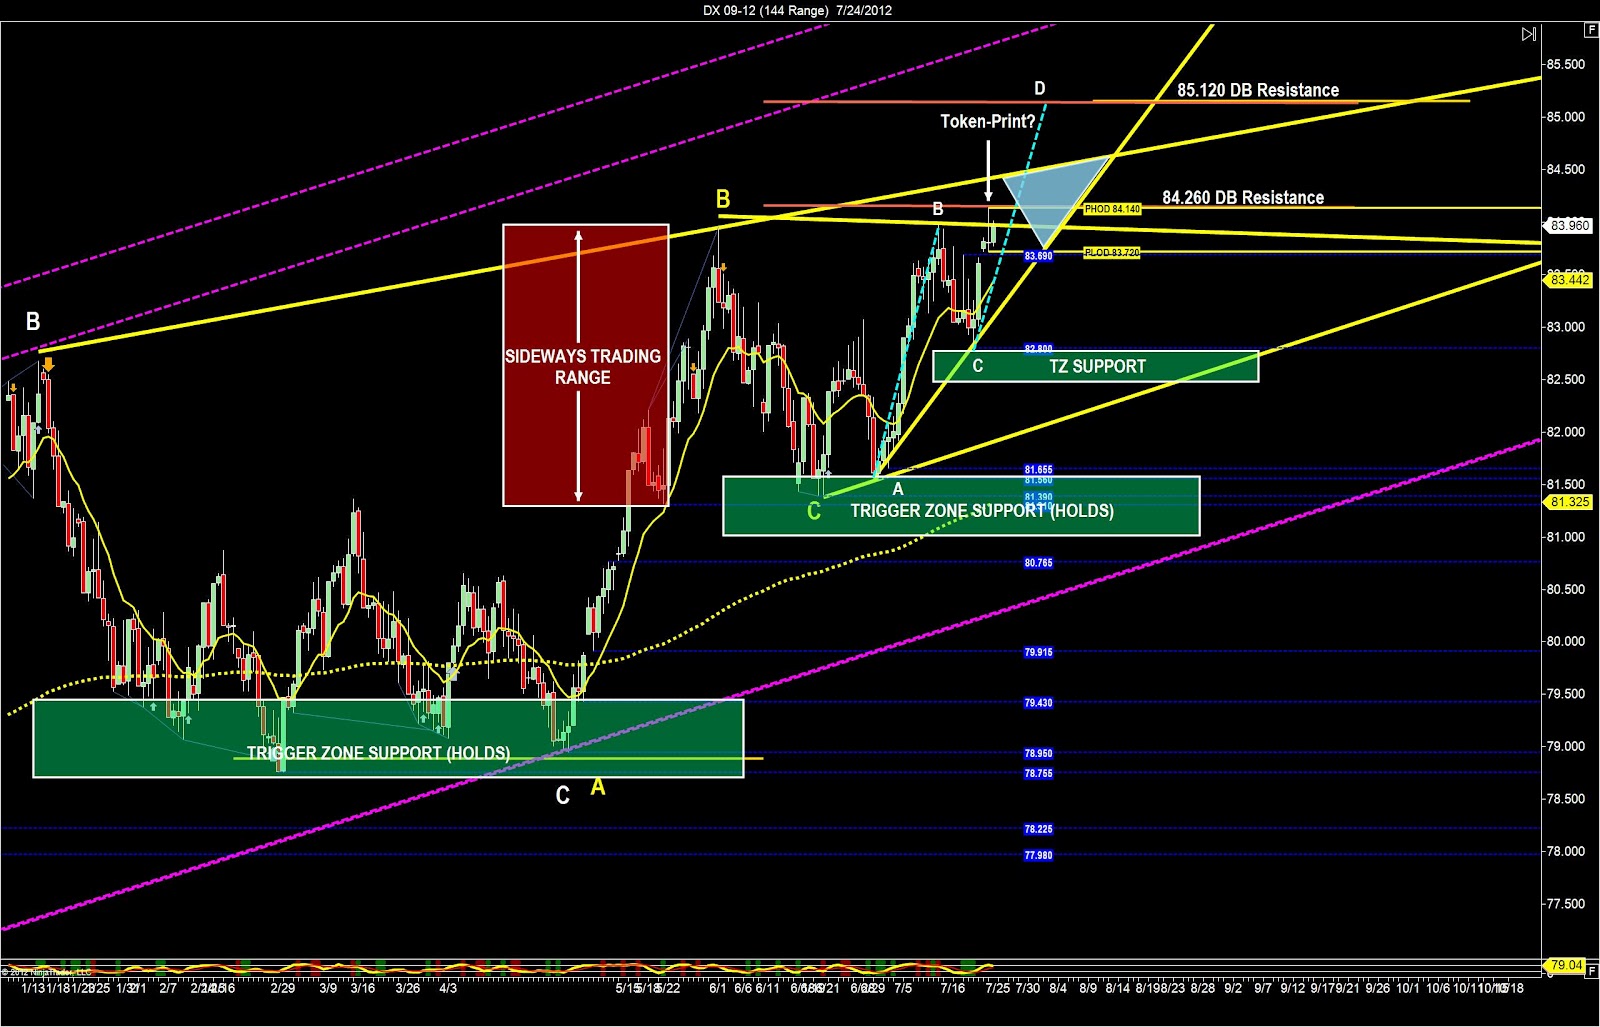
dollar index chart shows us the bullish price channel

8:00am EST
 The dollar index 144-range chart
shows us the bullish price channel with a short term bullish price wedge and a
recent failure to push new higher-highs.
We called this a token print, because the way the candlestick looks with
that BIG WICK, it tells us that the buyers tried, and failed very soon
afterwards. This candlestick pattern at
the highs tells us if the buyers lose control this is going to drop below the PLOD
and most likely tumble off the highs. We
can expect one more attempt to make new higher-highs but if that fails, look
out below!
 The 21-range chart shows us the short term bullish
price channel, along with the sideways range that developed on Monday using the
advanced price-structures price channel resistance. The heat map doesn’t give us much to work
with using the dollar index this morning, very little market personality, so we
need to use the dollar index carefully today, not much trust in the price
structure on the dollar index but this may change.