July 26, 2012
- in Uncategorized by schooloftrade
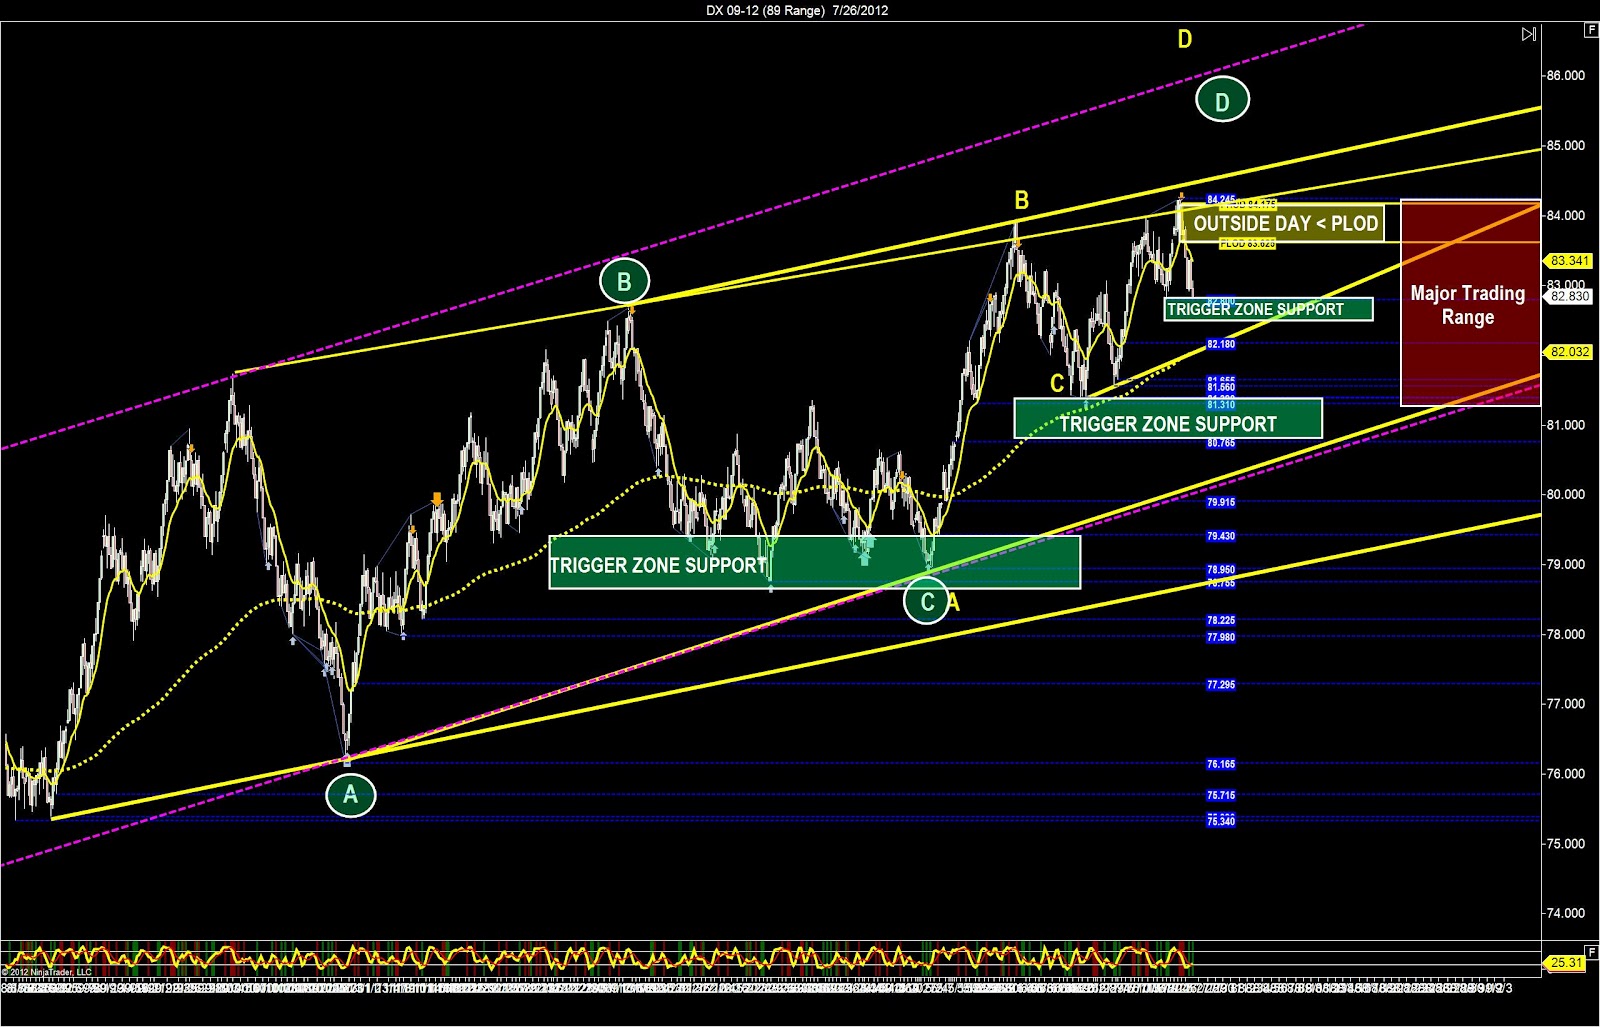
Dollar Index Chart Prep

 Heat Map: What is it telling us?
 Bearish dollar index = bullish
markets
markets
OHLC Analysis:
3/4 tells us short-side bias
Overnight Highs & Lows:
Well below them both, says bearish
Are we inside or outside day today?
Outside day, below the PLOD
What price-structures do we see?
Price wedge : bullish
Price channel : major bullish
Trigger-zone : we have 3
AB=CD Pattern : 2 bearish AB=CD Pattern
Zig-Zag: nothing at this time, we
need to buy at the lows of the bull price channel.
need to buy at the lows of the bull price channel.
Double-top / Double-bottom: has been violated by new higher-highs.
Range Highs and Lows: we can see a range from the recent highs down
to recent lows, marked in RED box.
to recent lows, marked in RED box.
Where will a reversal be likely
today?
today?
The dollar index will likely reverse
at the trigger-zone support 82.800 level
at the trigger-zone support 82.800 level
Where would the smart money be
trading today?
trading today?
Around the trigger-zone support is where we
assume traders will be reacting.