May 1, 2013
- in Uncategorized by schooloftrade
Do these charts KNOW what’s coming from the FOMC Announcement?

 |
| Crude Oil Daily |
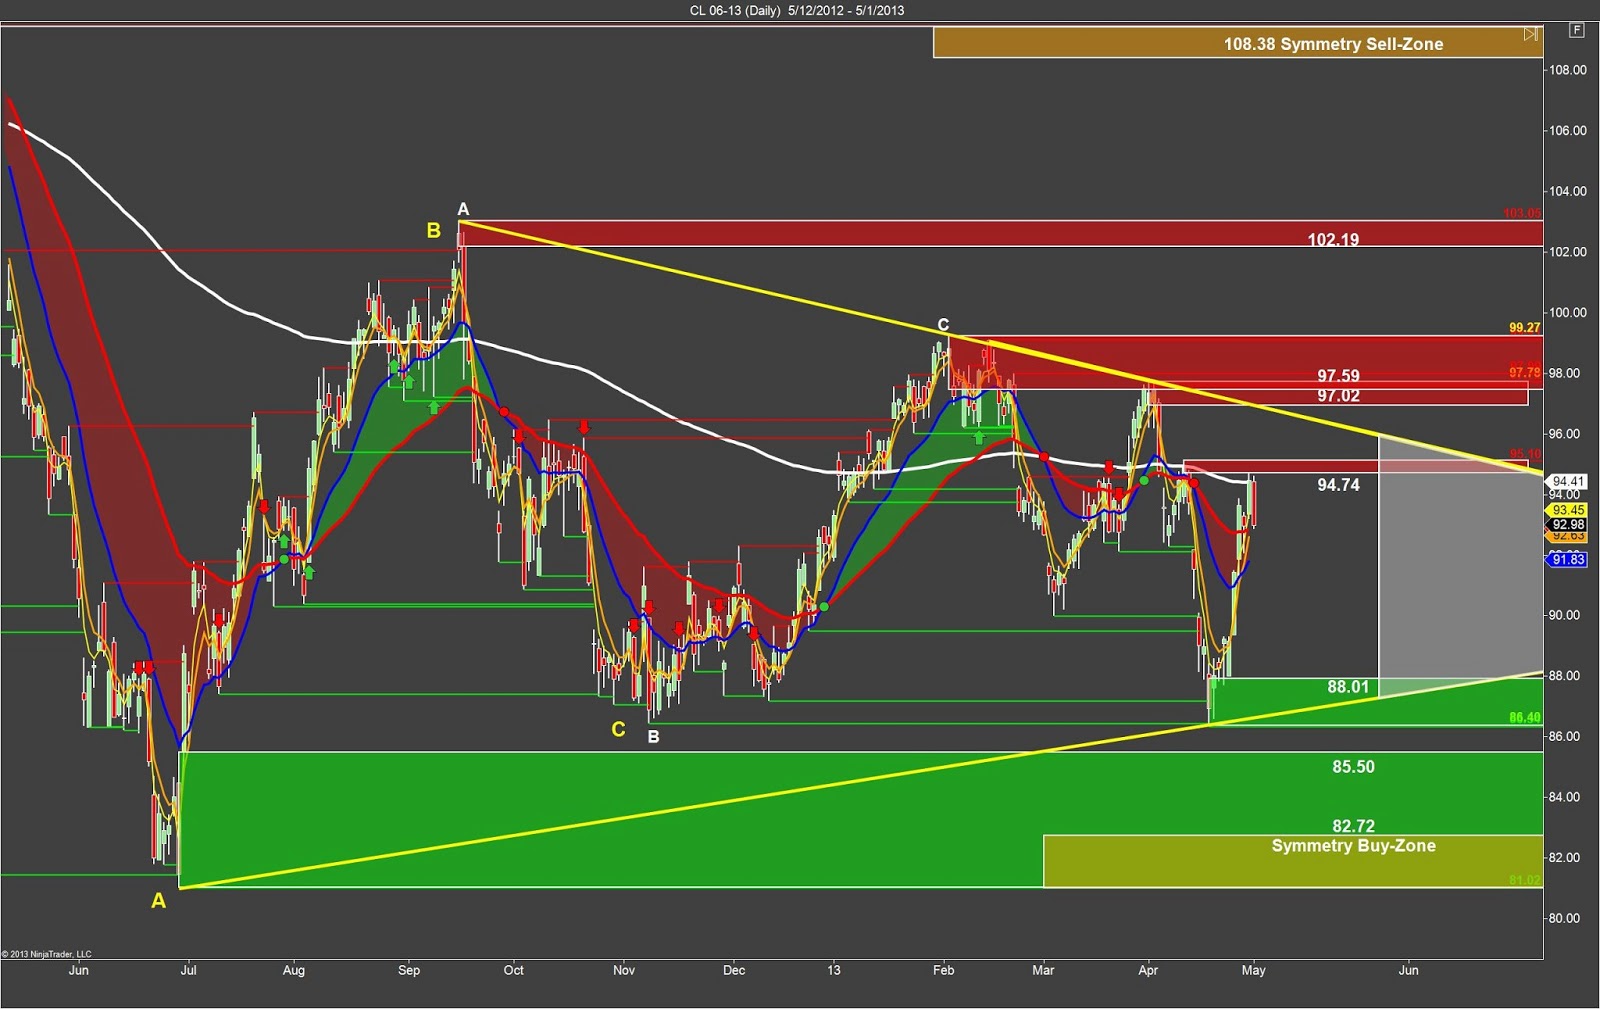
Crude Oil Daily:
The daily anchor tells us a big story when the daily candle
was unable to test the 94.74 sell-zone today.
How did we come THAT close and no test?
Looks to me like the buyers may have given up, or is this just a break
from the higher prices for a day and then re-gain the momentum back
higher? That BIG, red, ENGULFING daily
candle tells me there will be selling at the open on Wednesday ahead of FOMC
and Crude Oil Inventories
 |
| Crude Oil 60-Minute |
Crude Oil
60-Minute:
60-Minute:
The hourly anchor chart shows us the BIGGEST clue for our
trading tomorrow morning, and that is the bullish price-channel buy-zone at
93.00 area. We have been watching this
same bull price-channel for 2 days now, and we are finally in the buy-zone
looking for price to rise and close above the 93.26 so we can begin looking at
the Entry-Trigger Indicator for our buying opportunity back up to the
trigger-zone 93.87 and then 94.74 should be in the cards by end of the
week. We can easily see this is a great
area to be looking to buy, however, we need to see price-action move higher
early in the trading session on Wednesday, specifically I want to see it push
and close above the swing-high 93.26 to get long.