- in Uncategorized by schooloftrade
day trading strategy using FOMC Day

Our day trading strategy begins with gathering clues from the dollar index, which will tell us the short term trend so we can trade along with it, as well as major turning points in the market so we can look for price reversals.
This morning we can see the strong bear channel which is NOT our short term trend, the slightly bullish move off the lows has turned sideways and THIS is the short term trend. We do no tsee any short term trend at this time, and we will keep an eye on this.
We can see turning points above and below the dollar index and we are looking for the best opportunities when the dollar index is around these turning points.
 |
| Dollar Index 13-Range |
Our day trading strategy using crude oil futures uses a price wedge, an AB=CD Pattern, a trigger zone below and the big round number of 100.00 which will act like a magnet.
We are currently trading in the middle of the short term price wedge. We have the big round number of 100.00 above us which will act like a magnet if price rises. We have the major trigger zone support below and we have the AB=CD Projection which is telling us this price wants to go lower.
we will use this chart to find the big picture, see where the most important areas are going to be for our day trading strategy, and now we need a faster timeframe to zoom in and find the details of where and when we will enter our first trades today.
 |
| Crude Oil 89 Range |
Now using the 34-range chart on crude oil we can narrow down the specific entry locations for our day trading strategy using this price wedge. If price rises im selling the wedge highs and then selling the PHOD. If price goes above the PHOD I will look for the fake-out breakout and then look to buy a pullback with new higher highs. We need to assume it will fail above the PHOD first, and then let the buyers prove us wrong and then we buy pullbacks.
If price falls we can buy wedge lows, and then buy the major support at the lows of the short term trigger zone at 98.45. If price moves quickly through 98.45 it will signal seller strength and we then sell a retracement down to the next support which is a big round number 98.00 and then the biggest magnet is the PLOD where we have a final profit targets at the lows of the wedge which will be a little above the PLOD. If we get to the wedge lows we thenw ant to buy the wedge lows 97.60 area of higher.
 |
| Crude Oil 34-Range Chart |
 |
| Crude Oil 21-range |
We finalize our day trading strategy using crude oil futures with the 13-range chart and you can see the new short term bear price channel which will also be our guide for stops and profit targets moving forward.
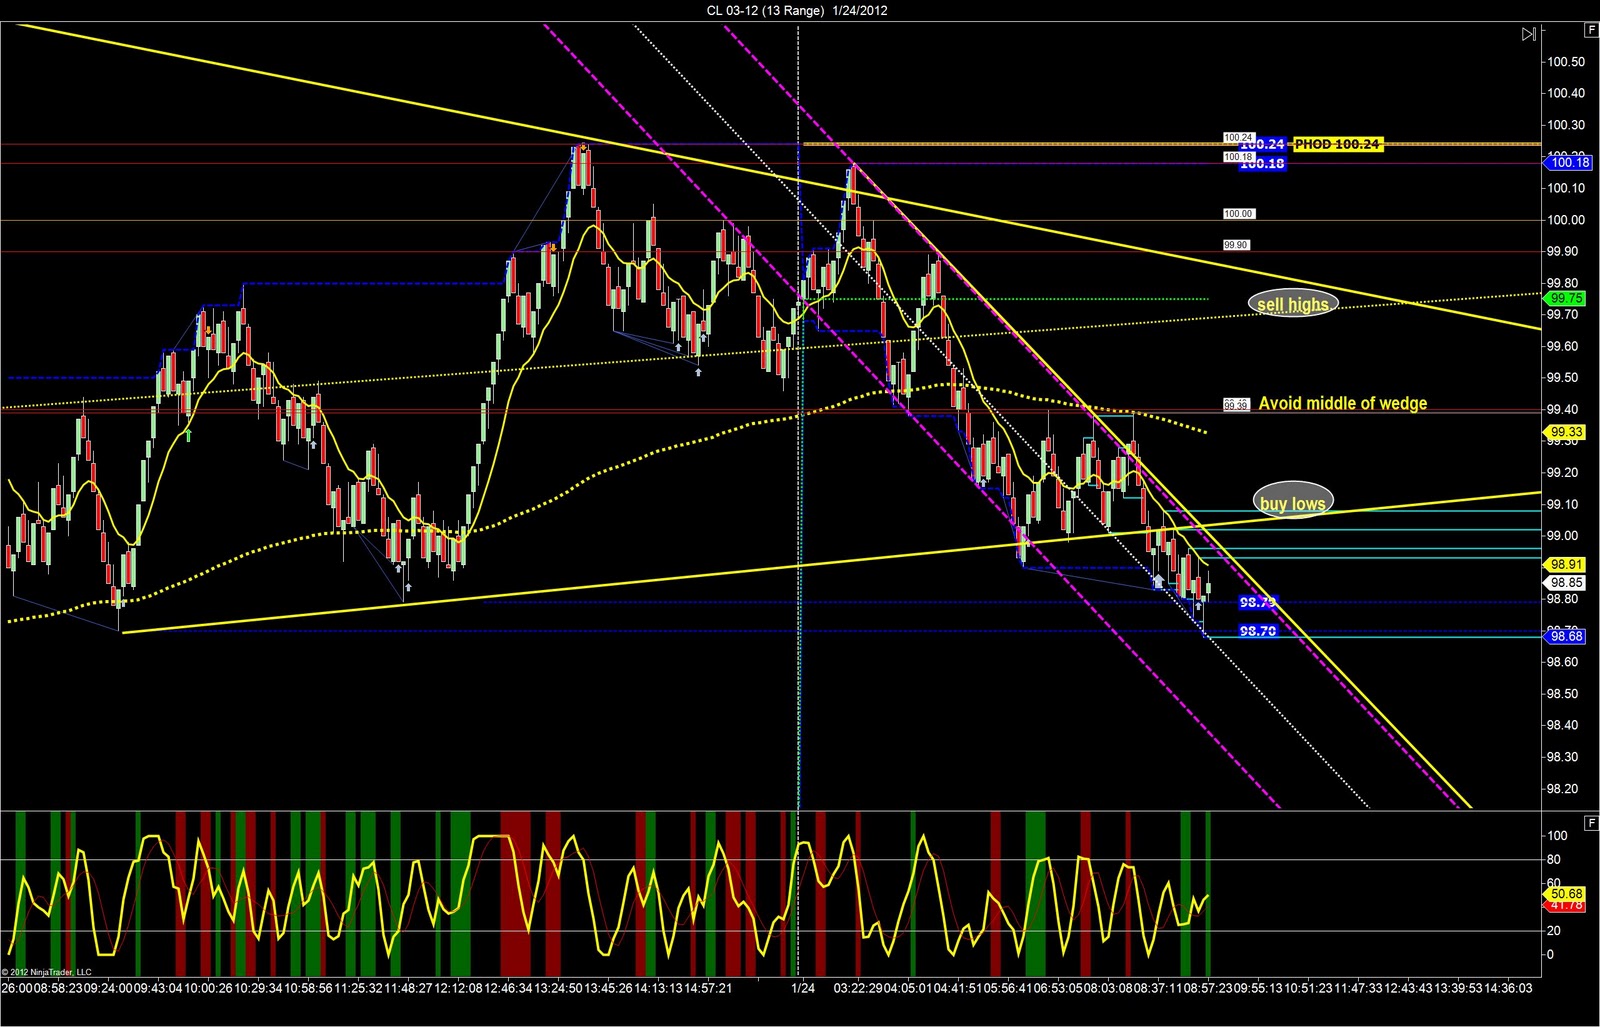 |
| Crude Oil 13-Range Chart |
The Euro day trading strategy uses the 89-range chart as the first stop in the analysis process and we see the inside day using Monday’s trading range, along with a price wedge and a trigger zone right in the middle around 2950.
 |
| Euro 89 Range Chart |
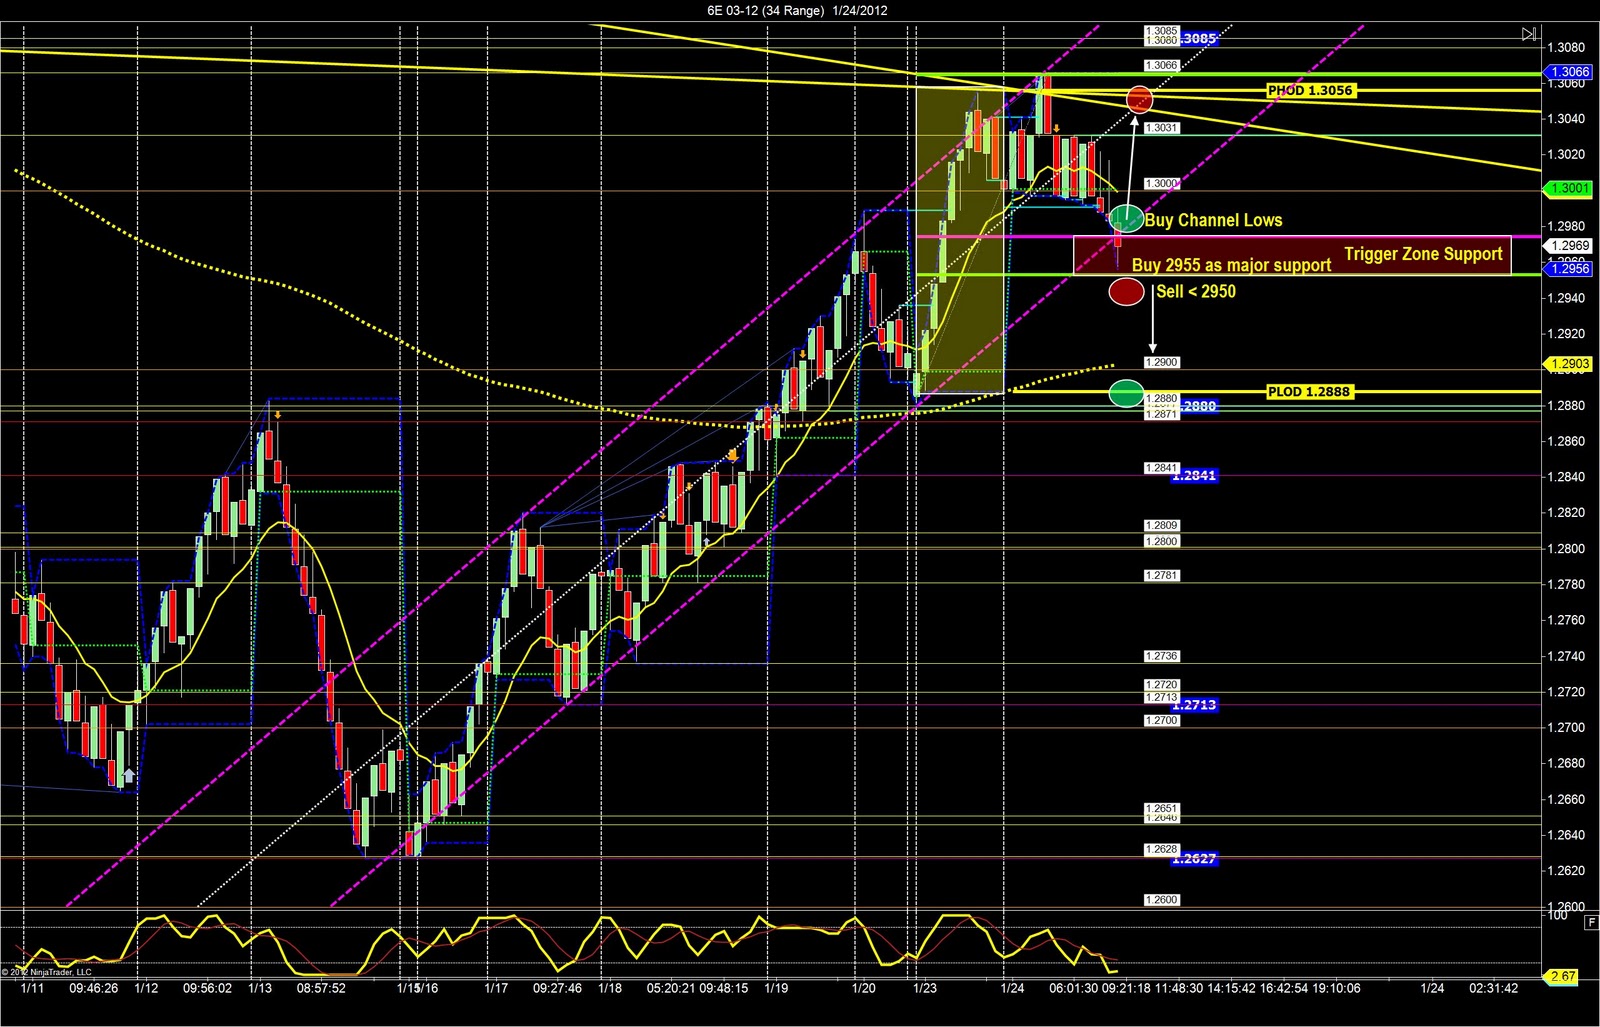
We then open the faster 34-range chart to help us define our exact locations for this day trading strategy. We can see the bull price channel and the trigger zone as major support so we want to use that first. If price rises im buying the lows of the channel and the trigger zone support. I will buy as far down as 1.2955 for the lows of the trigger zone. If price moves below 1.2955 i first look for the fake-out breakout and then with strong selling I sell a retracement with entry below 55. Final target going lower will be the PLOD and Big Round NUmber at 1.2900.
Russell day trading strategy uses the slower 89-range chart to begin our process of locating the best areas for our trades today. We see the bull price channel and the INSIDE DAY above the PLOD and below the PHOD which is a great clue.
 |
| Russell 89-Range Chart |
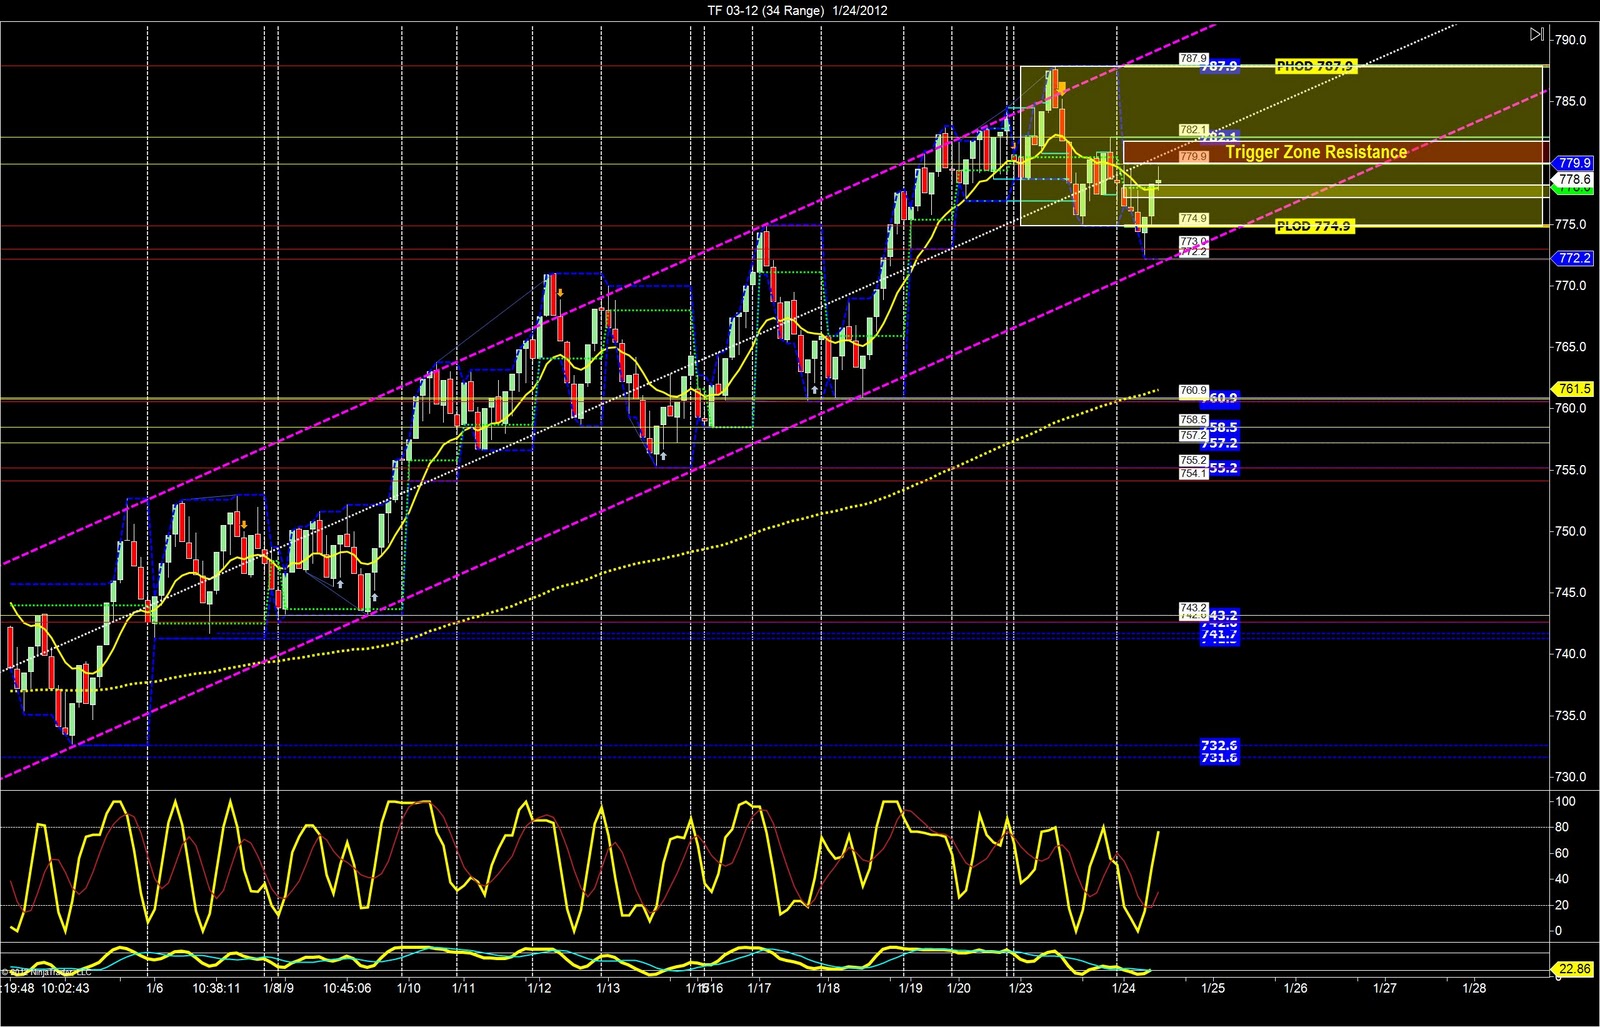
The Russell 21-Range chart gives us an easy plan of attack to execute our day trading strategy. We see the bear channel and we sell the highs of the channel. If price moves higher we look to sell at the next level of overhead resistance, use the red dots on your chart. The short term target is the PLOD and then you can hold belowe the PLOD or re-entry short below PLOD taking final profit at the channel lows.
 |
| Russell 21-Range chart |