- in Uncategorized by schooloftrade
Day trading strategy for FOMC FED Day and Crude Oil Inventories

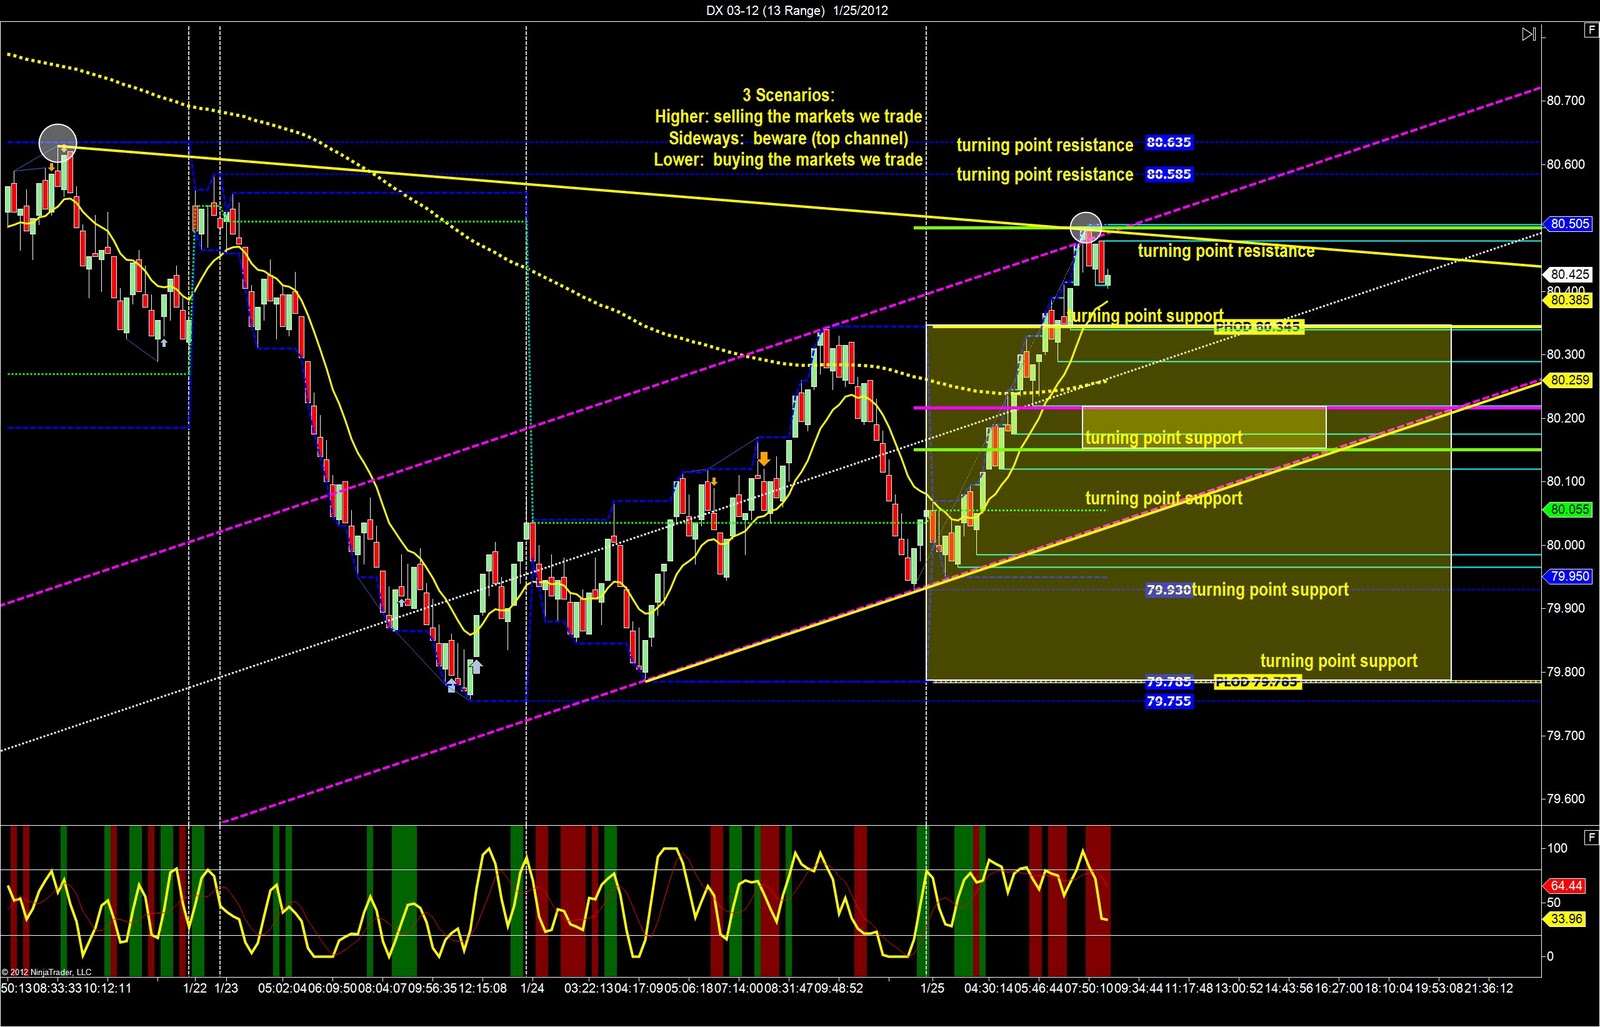
Our day trading strategy begins every day with the dollar index, and this morning we see a bull price channel along with an outside day above the PHOD. Both of these tell me to expect rising prices and to look to buy pullbacks with new higher highs. We dont trade the dollar so we will use its negative correlation to make educated decisions.
As we speak the dollar index is above the range from tuesday and at the highs of the price channel. If the dollar index falls off the channel highs we will buy pullbacks on crude oil, euro, gold, russell, etc.
If the dollar index chops around the highs and trades sideways we need to trade very cautiously because that is what we will get on other markets, and if the price goes higher it will likely break through the channel highs and then test the overhead resistance at 80.585 so expect rising prices that will quickly reverse off the major resistance overhead.
 |
| Dollar Index Trading Strategy |
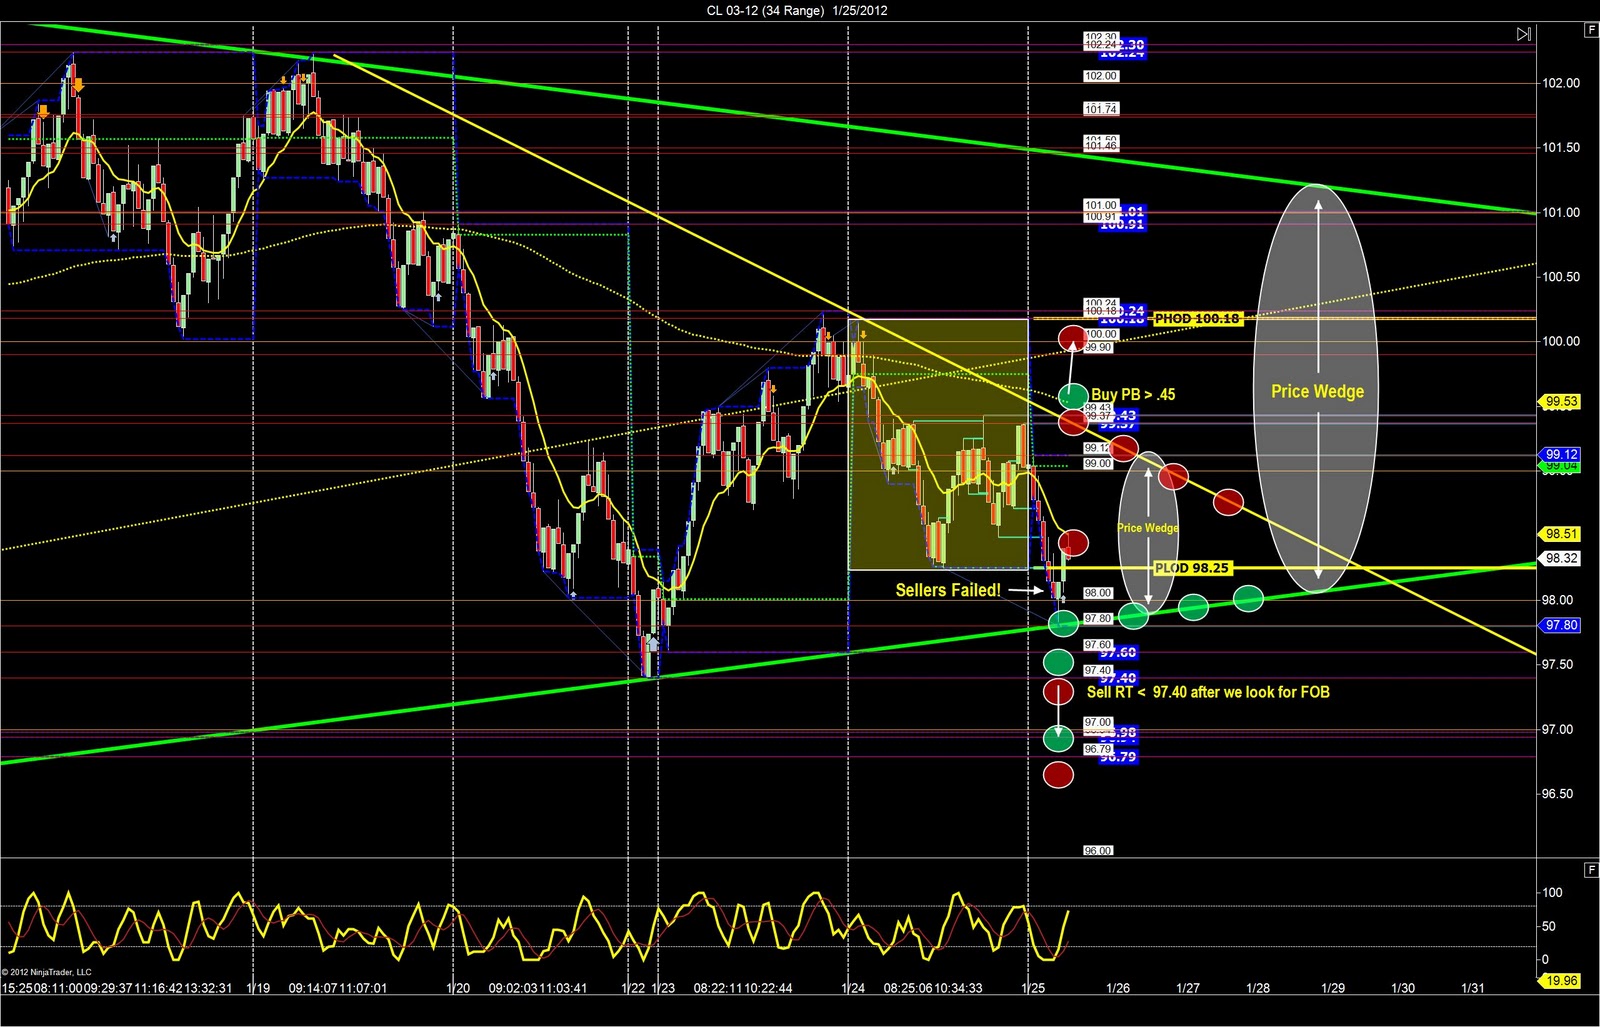
Crude Oil futures day trading strategy uses the 89-range chart to start our analysis of the trades we want to take today. We can see the AB=CD Pattern is still in play, but we can see the more important price wedge is showing support below us and resistance above us. We have a lot of support with the wedge lows and the major trigger zone below us so looking to buy the current area 98.25-98.50.
If price falls im buying at support until we get below the 96.98 then I will sell retracements as the sellers have broken the price structure and are clearly in charge at that point. I will sell the highs of the wedge as price rises and the 99.43 resistance above the wedge highs. if price keeps moving higher I will buy a pullback above 99.43 with the target long at 100.00 which will be major resistance in the form of the short term trigger zone. I can then buy above 100.45 but beware the fake-out breakout as we are in the mdidle of the bigger wedge.
 |
| Crude Oil Day Trading Strategy |
Our crude oil 34-range chart gives us much more detail for the specific entry locations for our trades. We are going to use the price wedge as our main focus so sell the highs, buy the lows, avoid the middle and remember to keep an eye out for the fake-out break with new higher highs or lower lows.
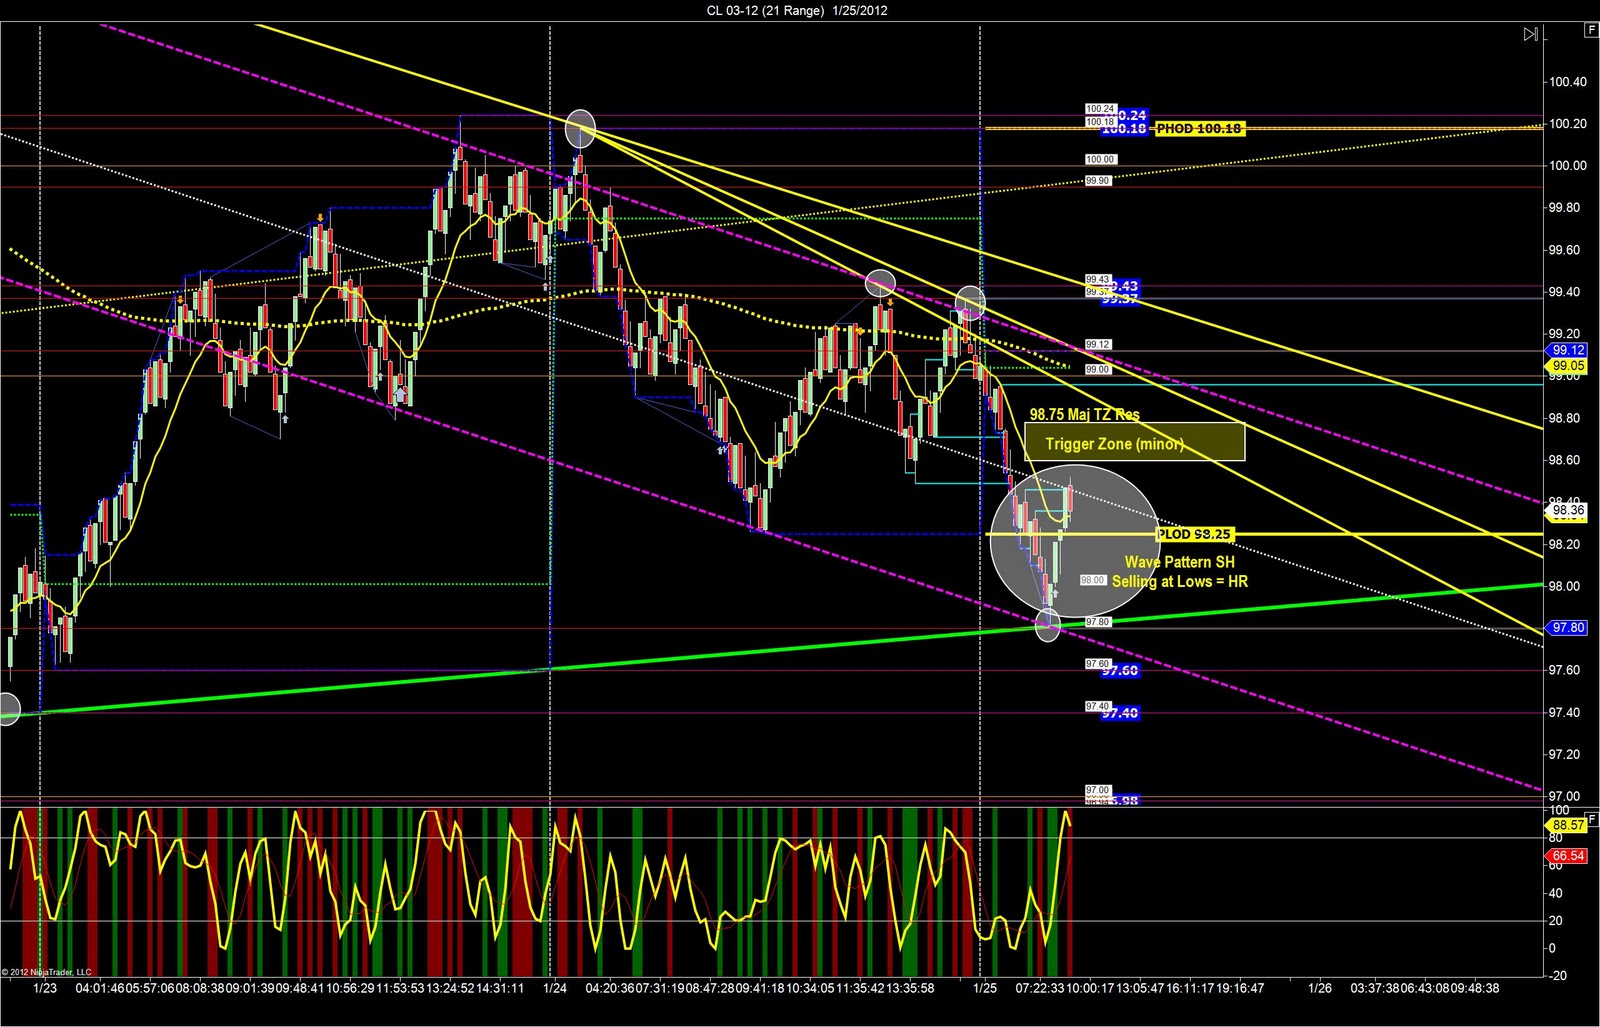
We use our faster crude oil 21 range chart to really refine our approach and look for any final patterns and price structures. You can see the new short term trigger zone and the bearish price channel we find on this faster timeframe.
The Euro Currency futures day trading strategy finds a bearish price channel so we expect the price will try to come back down to re-enter the channel, and we can see the inside day along with a very short term price wedge. We want to buy the lows of the wedge, and use the trigger zone as additional support. Remember the Dollar Index correlation is very strong with the euro, so watch that dollar.
 |
| Euro Day Trading Strategy |
The Euro 34 range chart further defines our trading strategy that will buy the channel lows, sell the highs of the channel, and avoid the middle of this range. If price falls i will be looking to buy the lows of the channel and the wedge. I wont be able to sell without too much until we get below the LOD 1.2933. If price moves higher I will look to enter with a pullback if we cant buy the lows of the wedge and channel. I need to beware trying to over-trade the middle of the range around 1.3000. Wait patiently if price is in the middle and then look to sell the highs. remember to use the dollar index correlation as your guide.
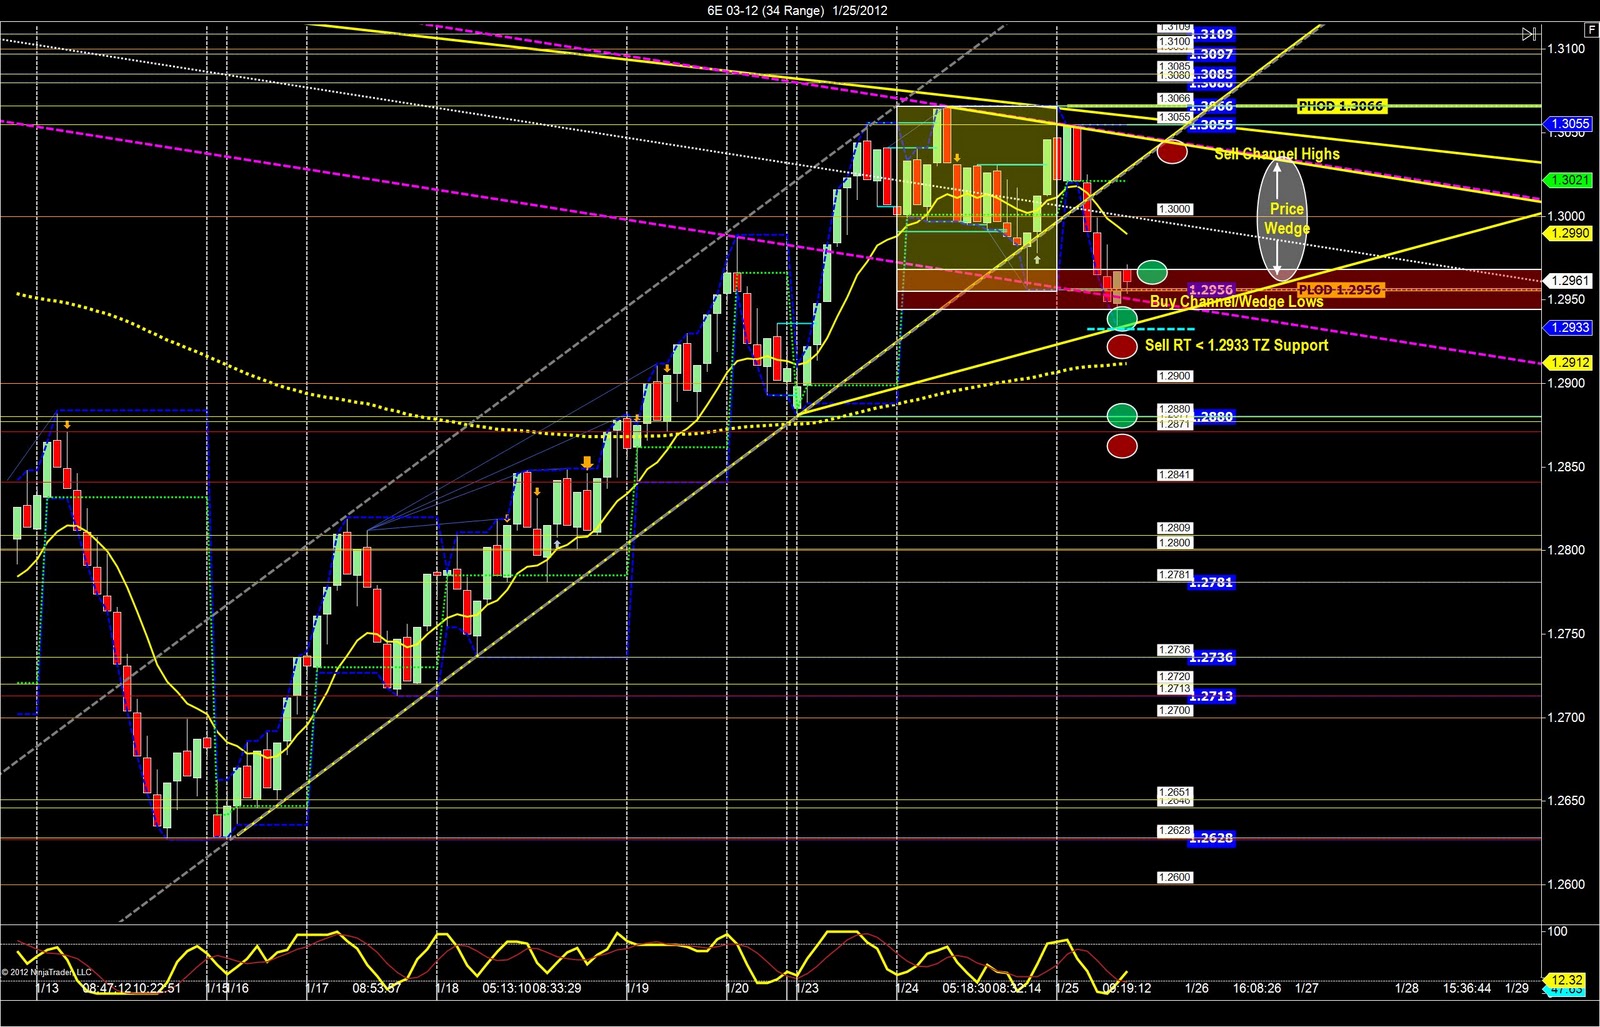
We finalize our eauro day trading strategy with the 21 range chart knowing where the major support is below us, and we need to buy the lows of the wedge, and then sell a retracements only below 1.2930 once we have proof the sellers are strong enough to break the wedge price structure.

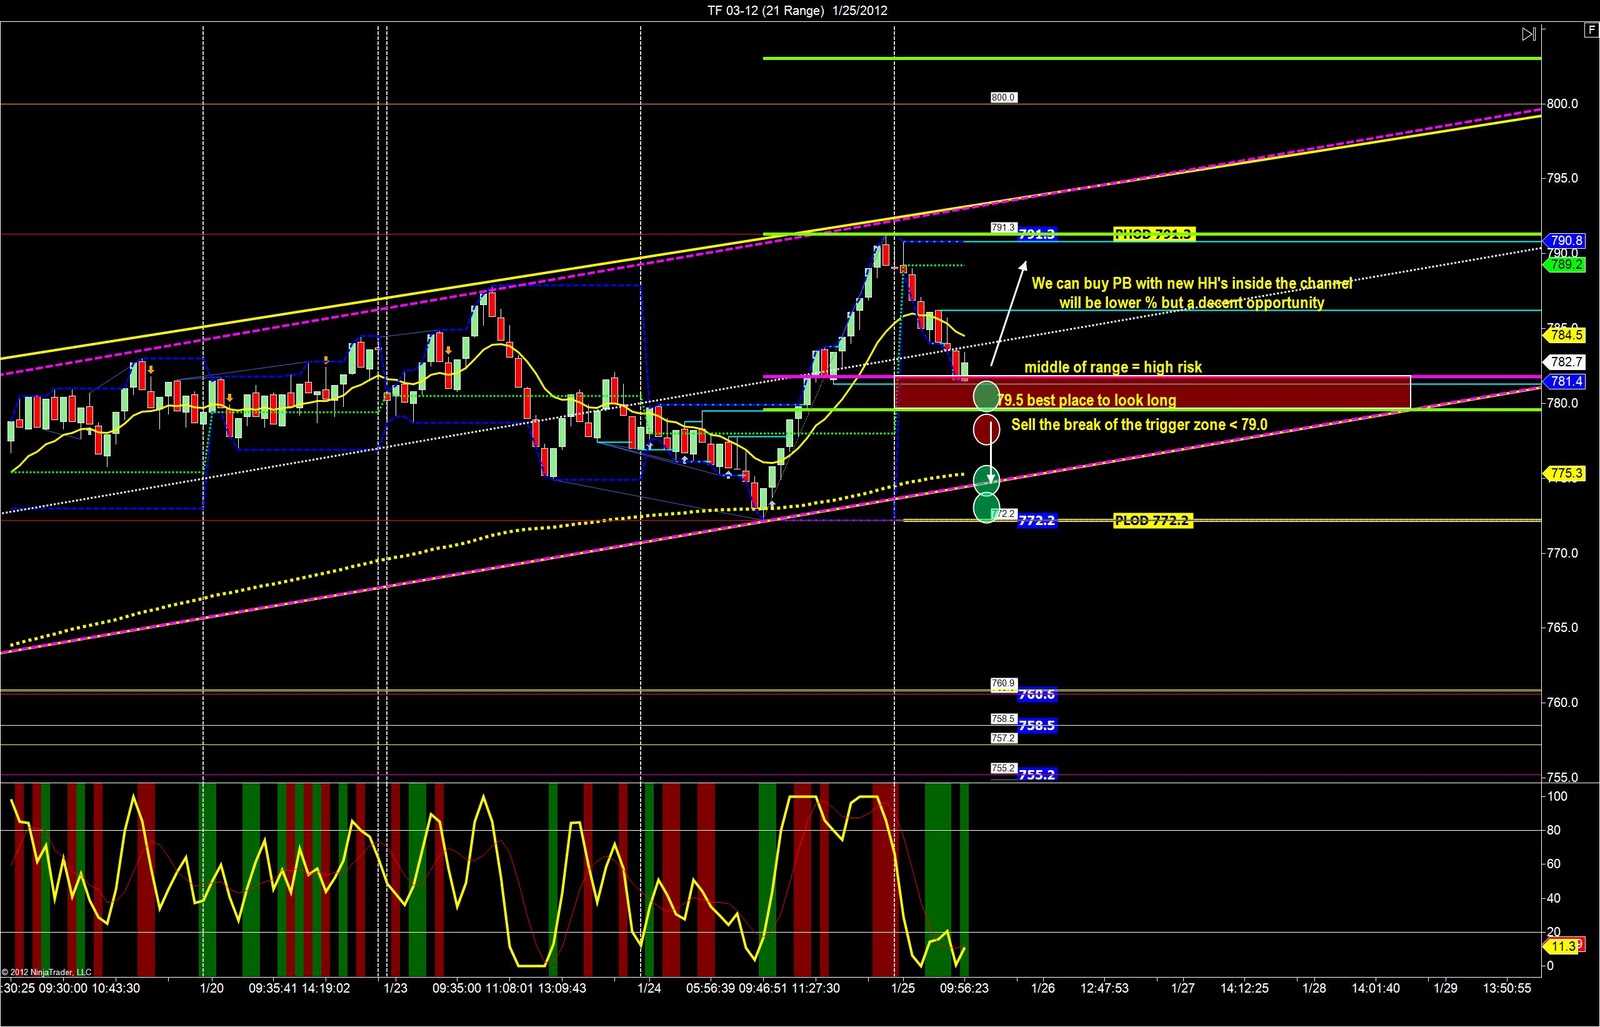
The mini russell futures will use the long term bull channel as our guide with our trading strategy this morning. We want to buy the channel lows and the PLOD as support as price falls. We had an early-morning opportunity around 915am EST to sell the PHOD when the buyers failed, and if you missed it we need to wait now.
 |
| Mini Russell Trading Strategy |
The Russell 34 range chart shows me the specific entry locations and the direction of the trades I need to focus on for the highest percentage opportunities. our day trading strategy using the channel says to buy at support and then with new lower lows look to sell a retracement. As price falls we look to buy the major support at 79.5, and then look to buy the channel lows.

We define our trading strategy on the mini russell with specific entry locations using the 21-range chart. We can see the bullc hannel and the best buying opportunities will be at the 79.5 or if price goes lower at the channel lows around 776.0