June 14, 2012
- in Uncategorized by schooloftrade
Day trading strategy for dollar index

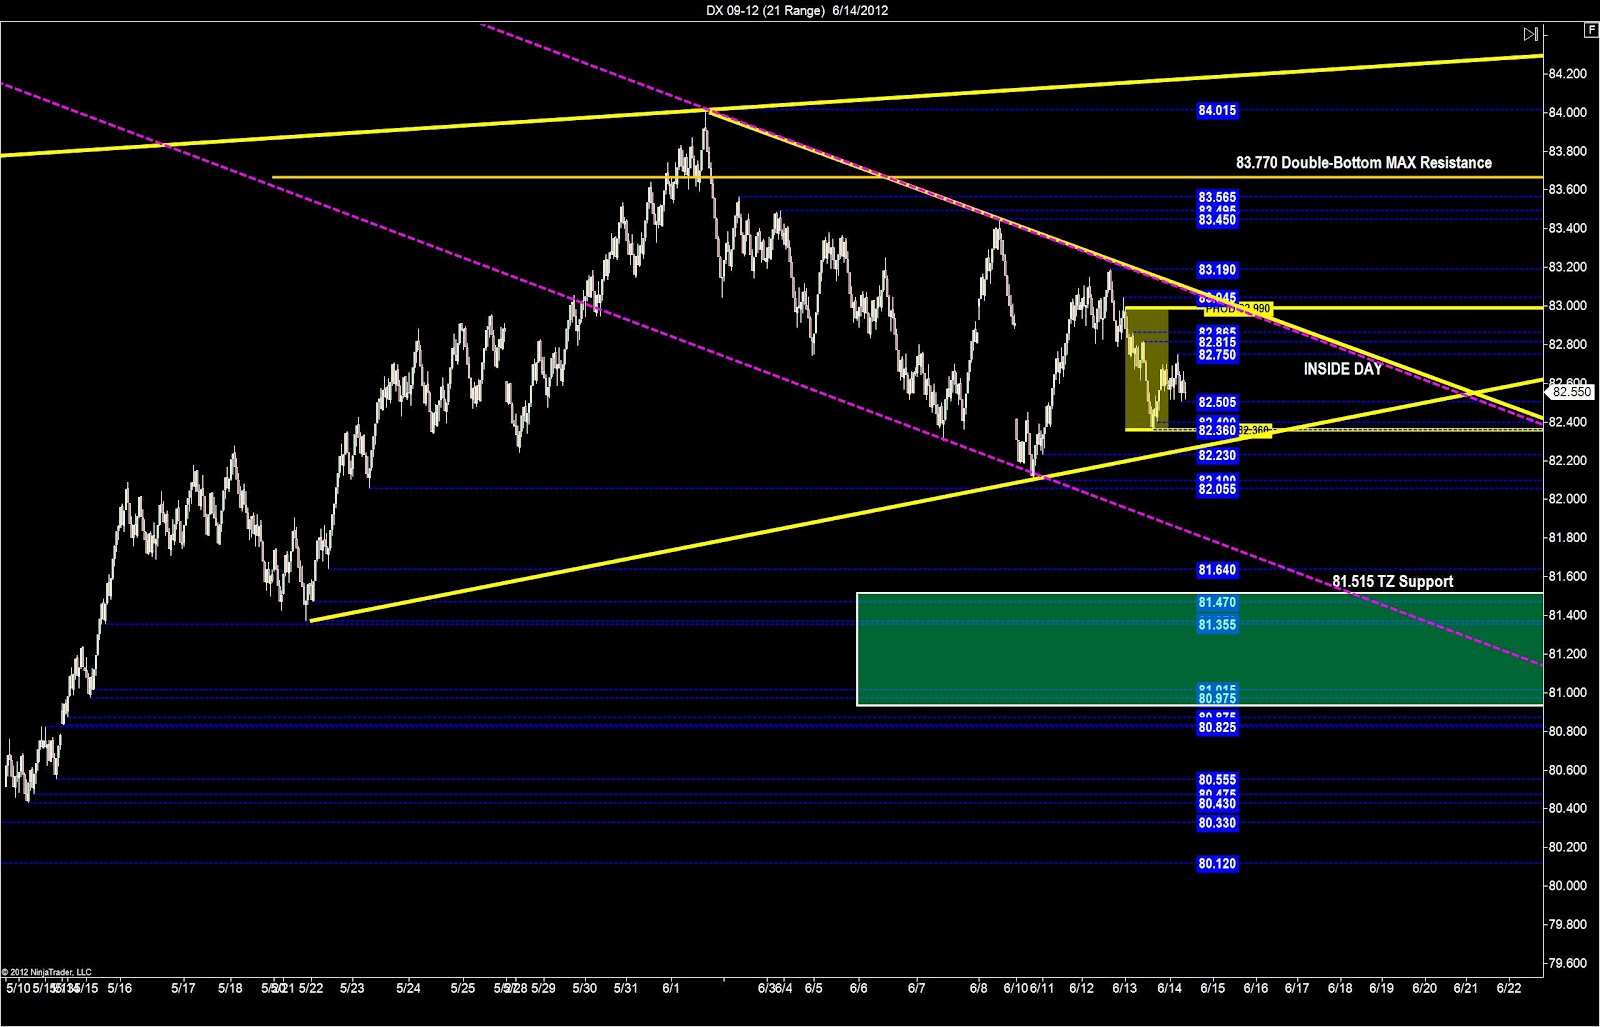
 We have an ‘inside trading day’ on the dollar index and we
have now completely rolled forward to the 09-12. We can see the major bullish price channel along
with support from the trigger-zone below at 81.515, and the short term sideways
trading range that puts us directly in the MIDDLE of today’s range. When we find the dollar index in the middle
we know that other markets will be narrow and range-bound. This can change quickly, and with news in a
few minutes we may see the highs or the lows tested shortly, so be ready.
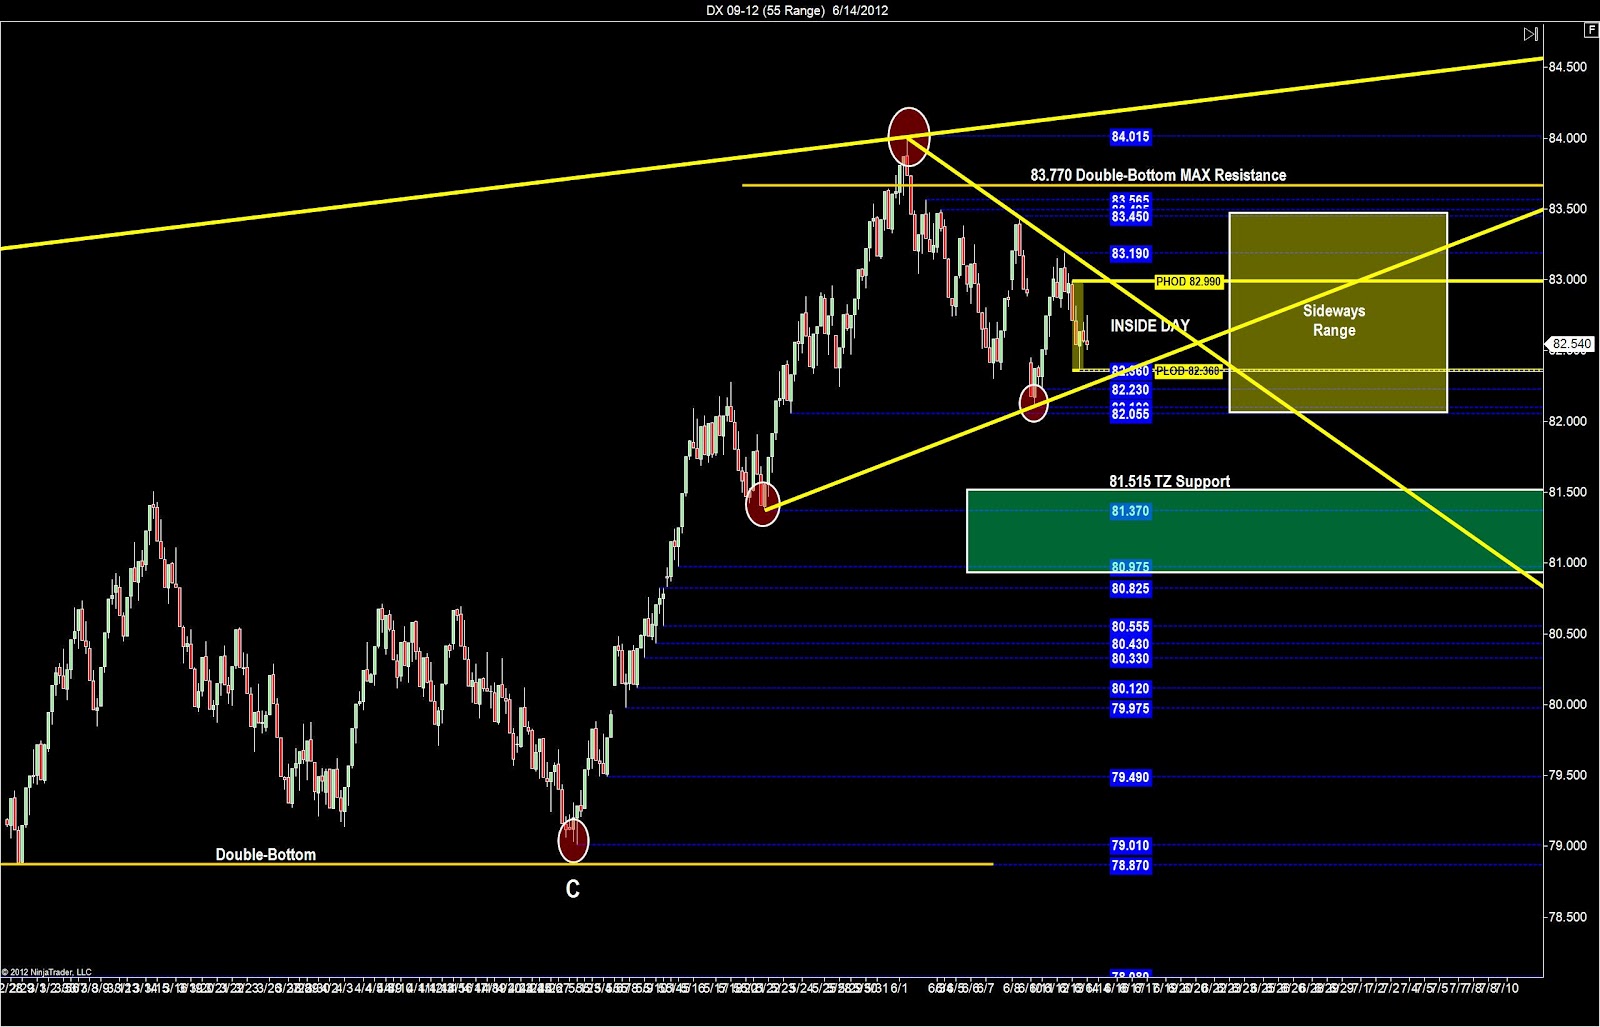
 We dig in a little deeper on the 55-range chart, a faster
timeframe, and we see the most important clue we can get today. We have a short term sideways price wedge structure,
and when this is above the PLOD and below the PHOD we know this is a big red
flag. A narrow price wedge on the dollar
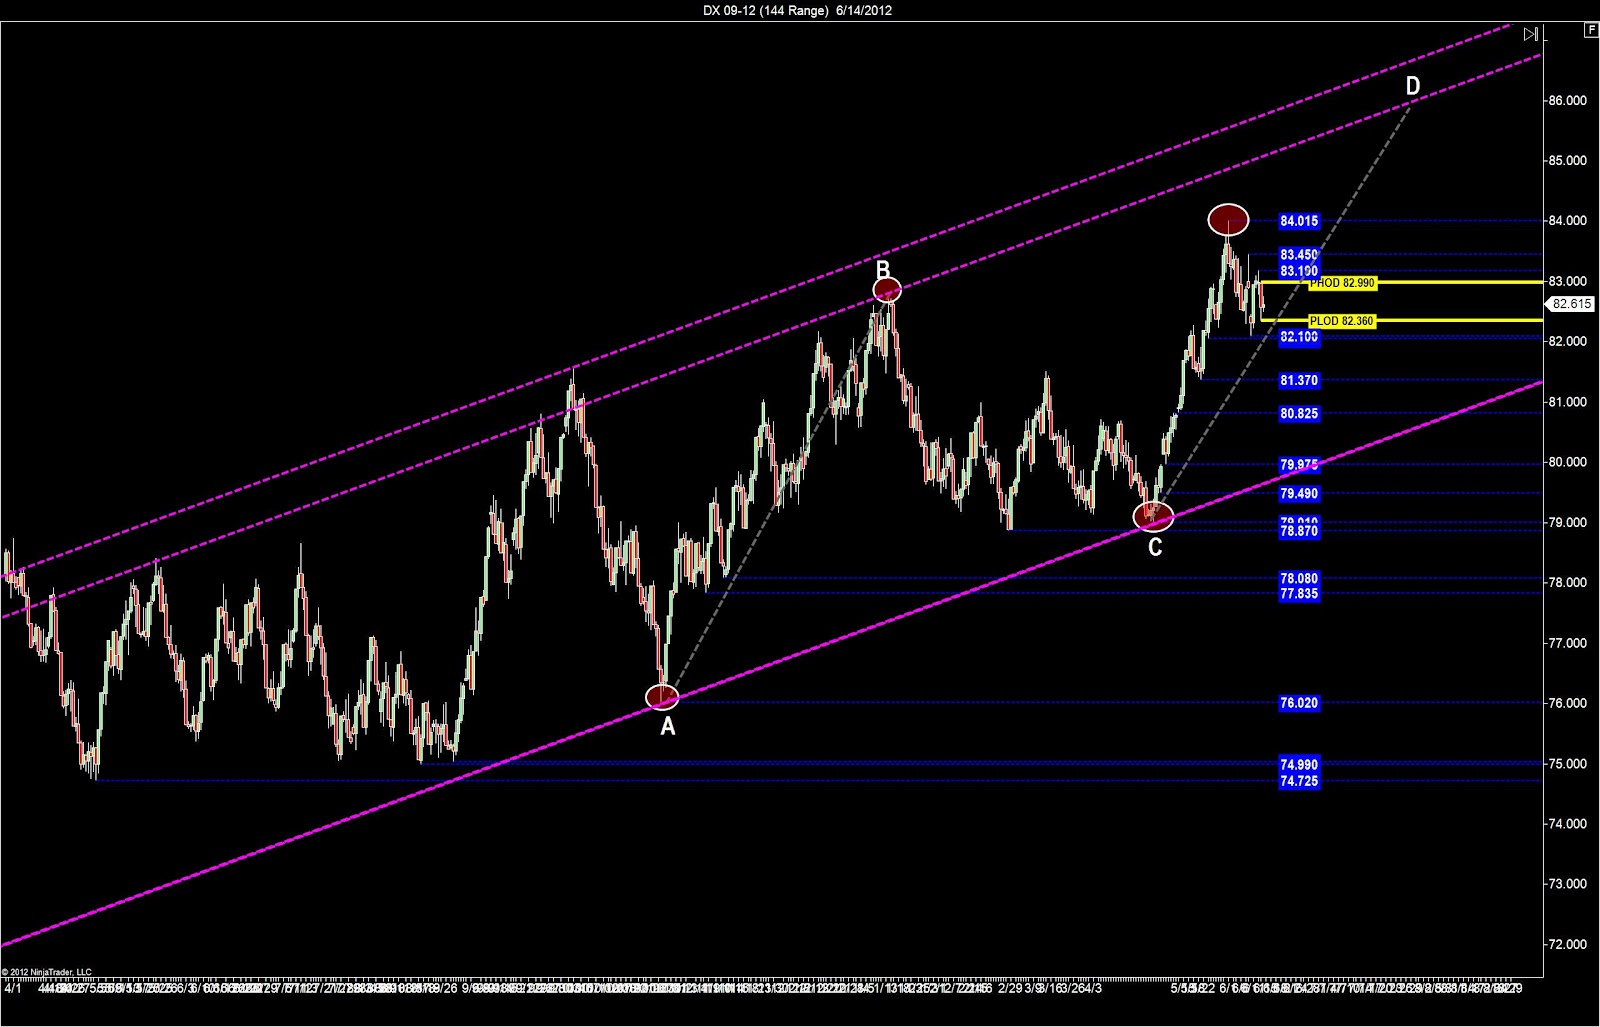
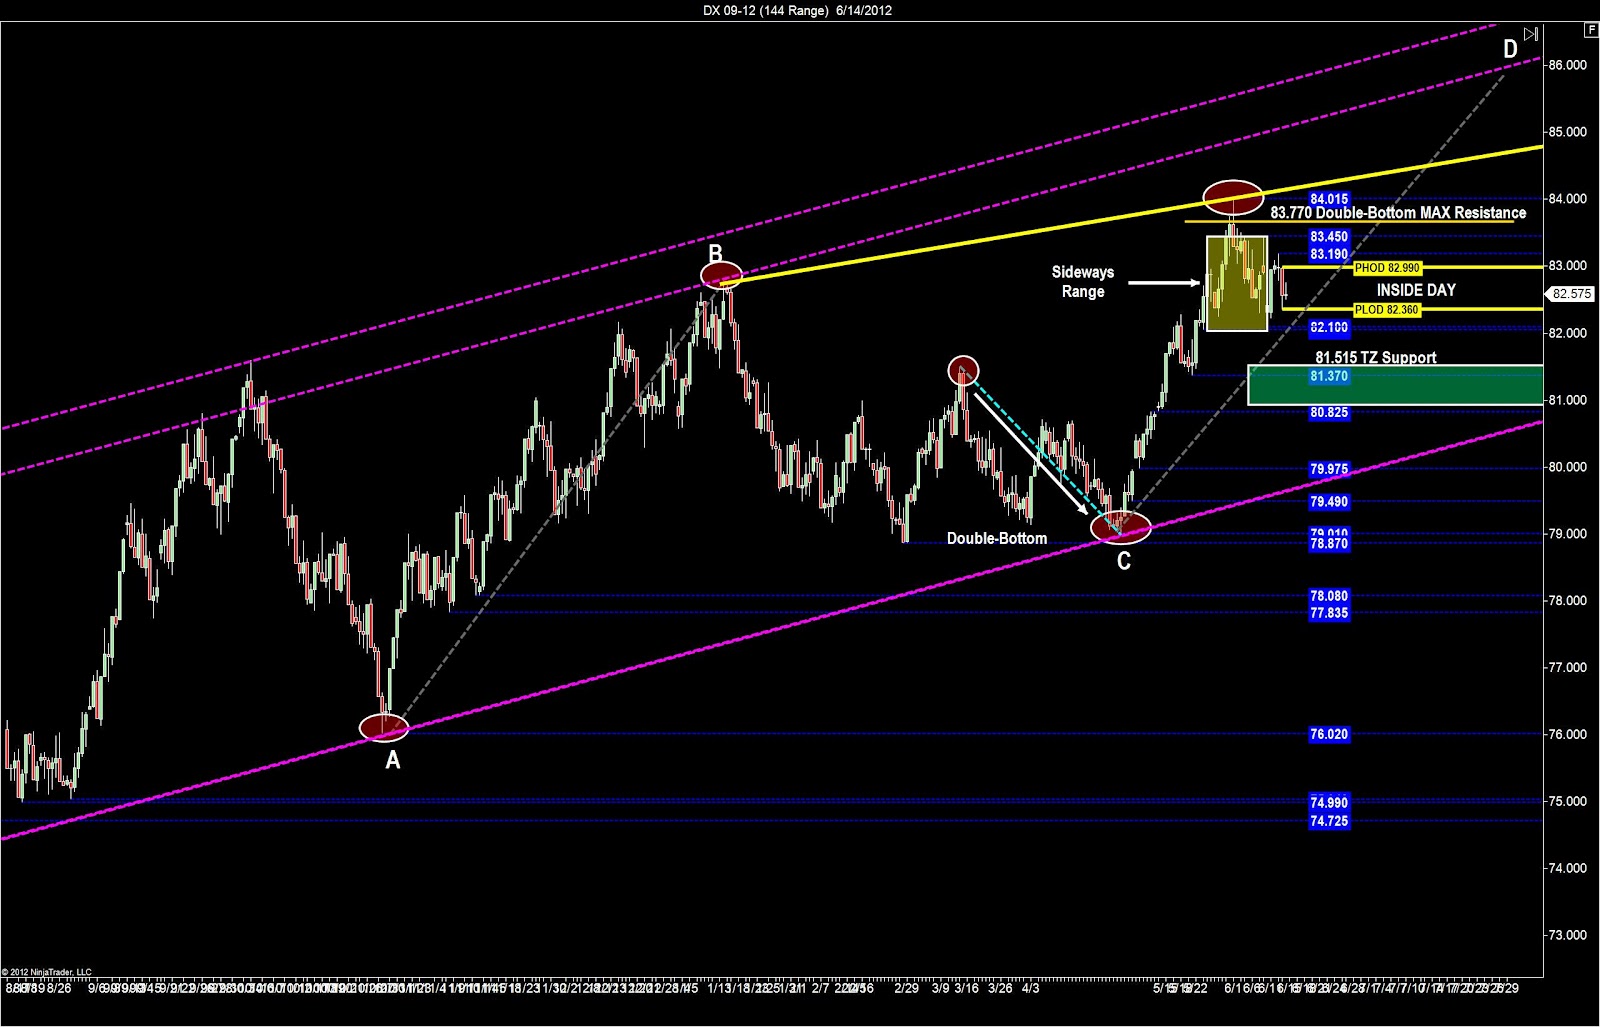
index will produce a narrow price wedge on everything else we trade. Additionally, the 21-range chart locates
another bear price channel which can also be used as support and resistance.
Our plan for using the dollar index correlation
today will be to use the price wedge and the potential for fake-out breakouts
and failures as our biggest clue. With
the dollar index inside day and inside the price wedge we will sell highs and
buy lows on the markets we trade, assuming that any breakout is ripe for the fake-out
breakout. So we will fade-the-breakouts and
we will assume this will continue until the dollar index moves outside day or
outside of the price wedge.