March 1, 2012
- in Uncategorized by schooloftrade
Day trading strategy for dollar index

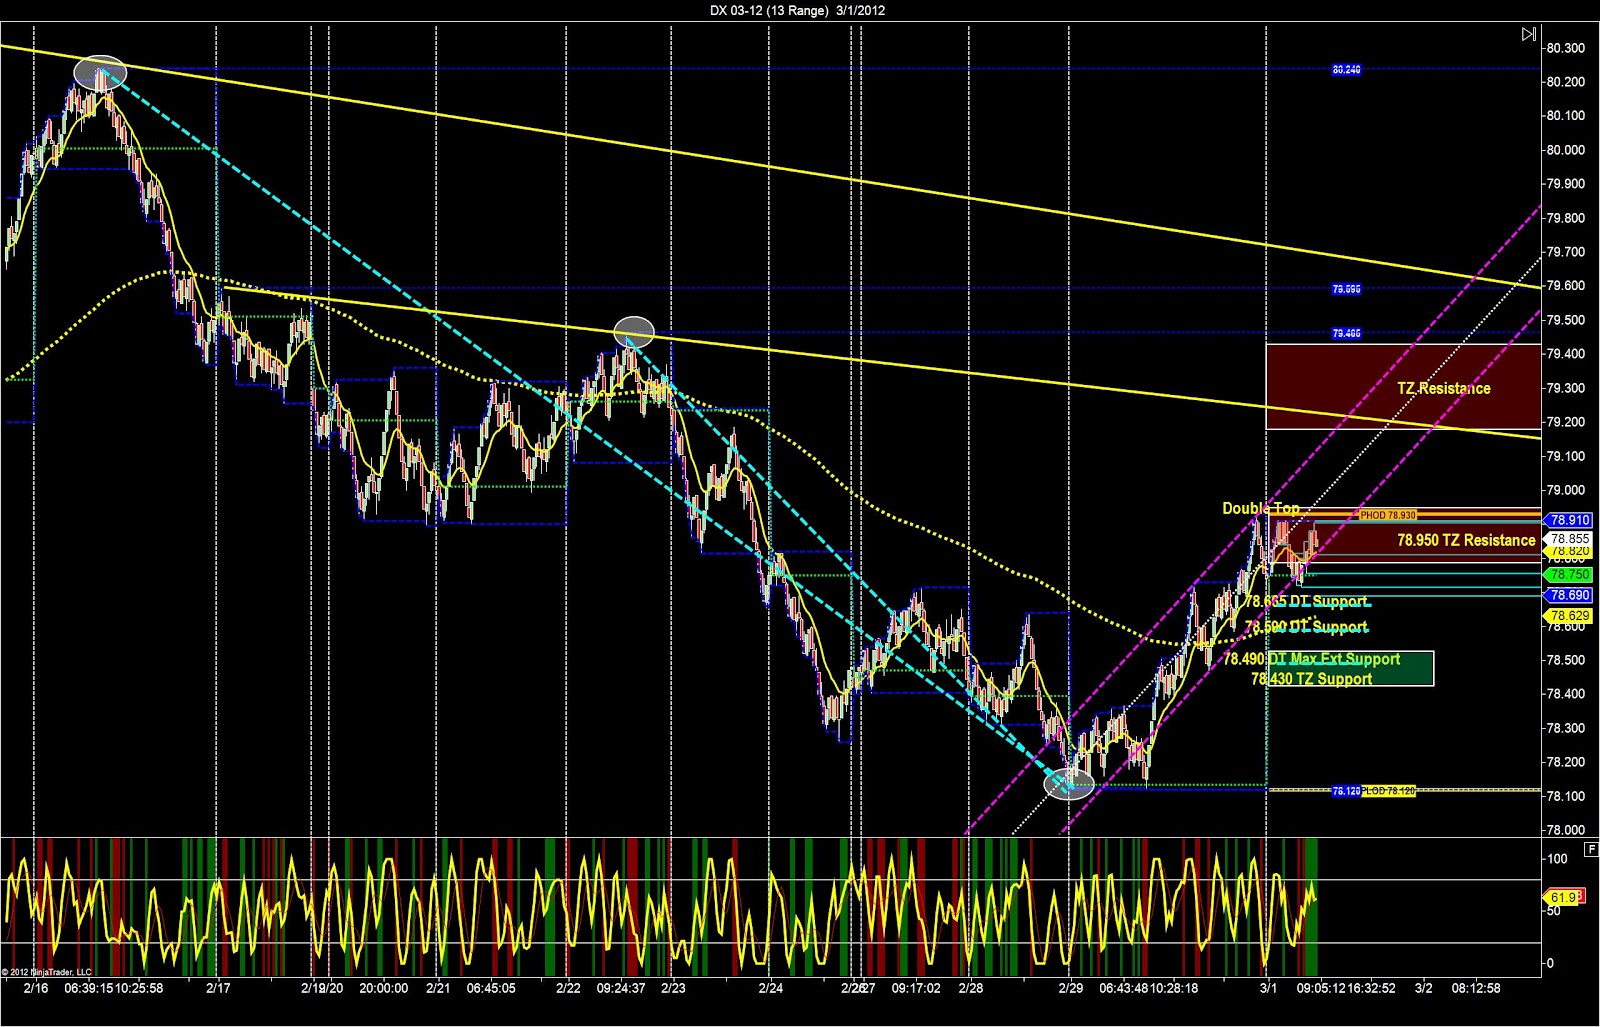
Day trading strategy for dollar index uses multiple
timeframes and begins with the 89 range chart to find the most important support
and resistance levels. We can see the
major trigger-zone below us has held as support, and we trade this morning at
the PHOD which means we can expect to see rising prices on the dollar index if
we break above the PHOD. We have a trend
line for resistance overhead and the trigger-zone above us starting at
79.180.
If price falls off these highs we can easily expect the dollar
index to drop 78.150 the PLOD and if price moves higher we can expect a test fo
the trigger-zone and the trend line above us, so use these as the major turning
points in the market.
index to drop 78.150 the PLOD and if price moves higher we can expect a test fo
the trigger-zone and the trend line above us, so use these as the major turning
points in the market.
The 89range chart does NOT show me the short term trend, so I
need the faster, 13 range to accomplish that.
need the faster, 13 range to accomplish that.
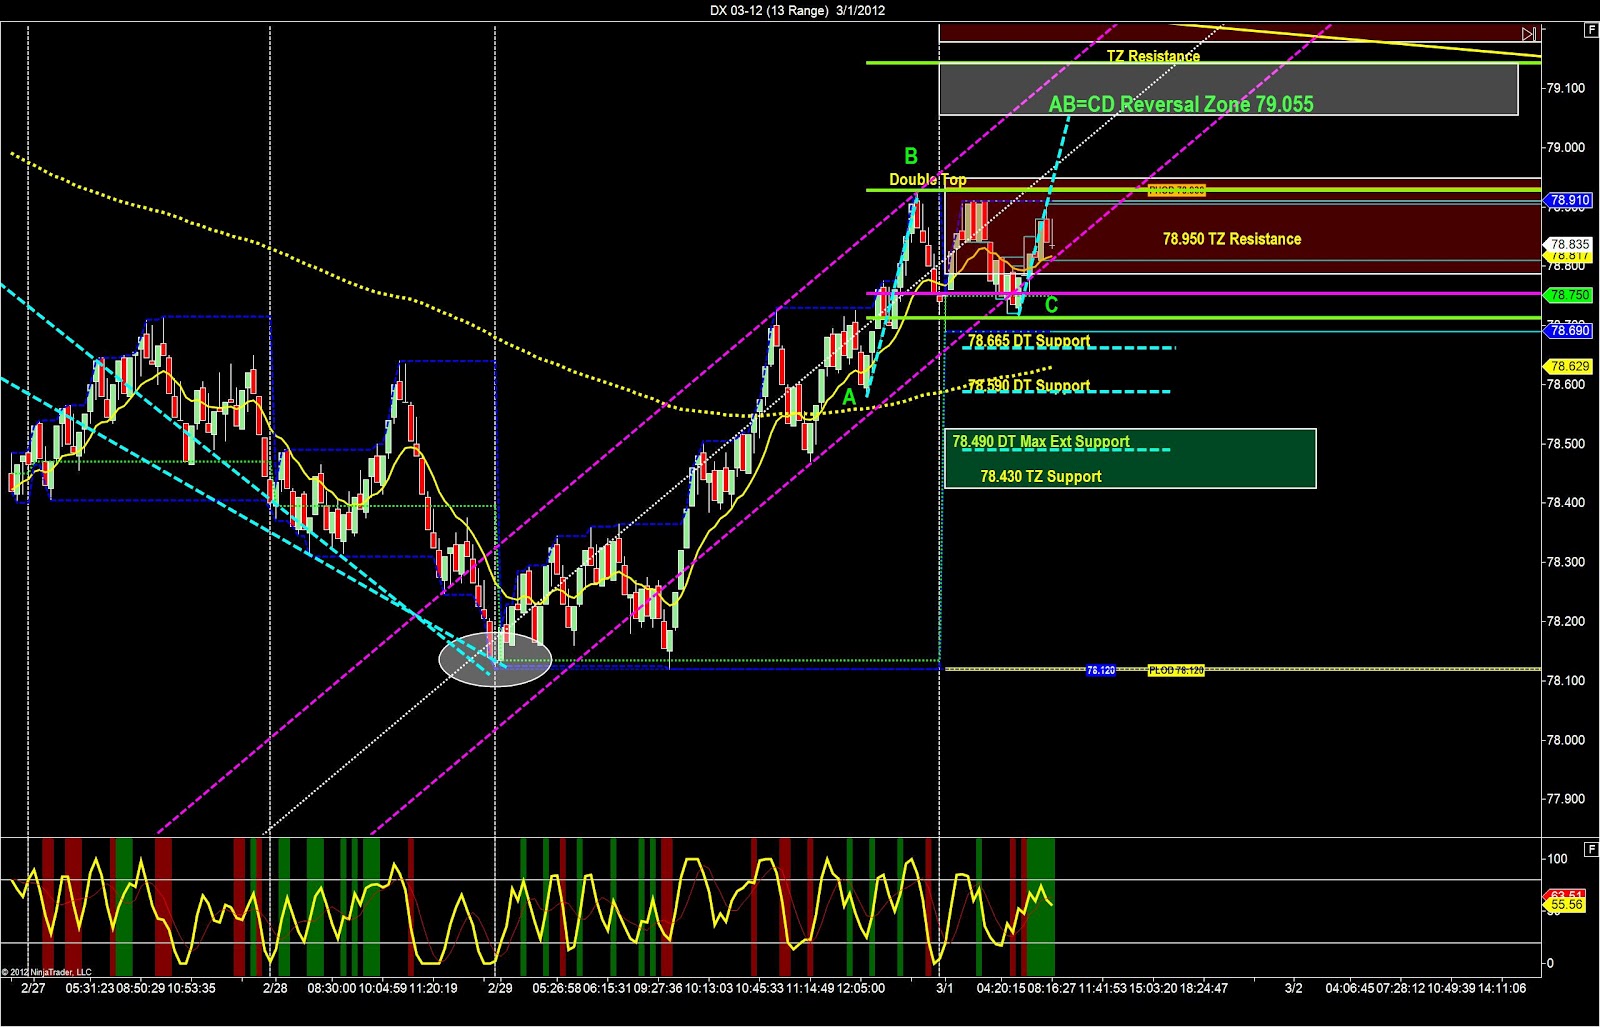
The 13 range chart shows us lots of clues this morning and
its important that we know which clues tell us to do what, and how to use them
correctly. We have the major trigger-zone
overhead as resistance starting at 79.180 so as price rises we begin to see
resistance overhead. We have a short
term bull price channel with an AB=CD pattern which also provides additional support
and resistance. You can see the AB=CD reversal-zone
overhead at 79.055 and we also have a double-top which provides us with support
if price falls. We can also see a short
term trigger-zone support below us 78.430 when we go from the recent swing-low to
the recent swing-high. We’re also
trading inside the range from Wednesday so we need to remember that when price
rises above the PHOD and then above the double-top resistance we can then start
buying pullbacks and with the negative correlation on the dollar index new higher-highs
on the dollar index will results in new lower-lows on the markets we trade so
selling retracements on crude oil, euro, E-Mini-Russell, gold futures when the dollar
index makes new higher-highs.
The flat price action, the lack of trend tells
me that I will be buying and selling with the same likeliness of success, there
is no directional bias until the dollar index forms a trend. We also know that if the dollar index rises
we have turning points overhead and that we expect price to rise much faster
above the PHOD. We also know if price
falls the buyers will have failed and the double-top support will likely try
and hold so look for support to push prices back up into the current trading
range. We are going to be looking for
the best trading opportunities to come when the dollar index is trading at
support or resistance, or as we call them, turning points.
 |
| Dollar Index Trading Strategy |