- in Uncategorized by schooloftrade
Day Trading Strategies for Euro, Crude, Russell and Gold futures

We begin our day on a Monday morning, with the main focus of staying patient and putting together a day trading strategy that will wait for the news after 930am est, and use the dollar index correlation as our guide.
Im looking for major turning points on the dollar index for this trading strategy to work well. My 144range chart will show me the BIG PICTURE so I can find the most important turning points on the dollar index.

Now we can move faster, looking for more clues to finalize our day trading strategy, so next we use the 89range chart.

The Faster timeframe Dollar Index 13-Range chart shows 2 big clues. First, the outside day tells us to sell retracements, and second, the bear price channel tells us the sellers are there in charge. We need to buy pullbacks as the dollar drops, and sell retracements as the dollar rises.

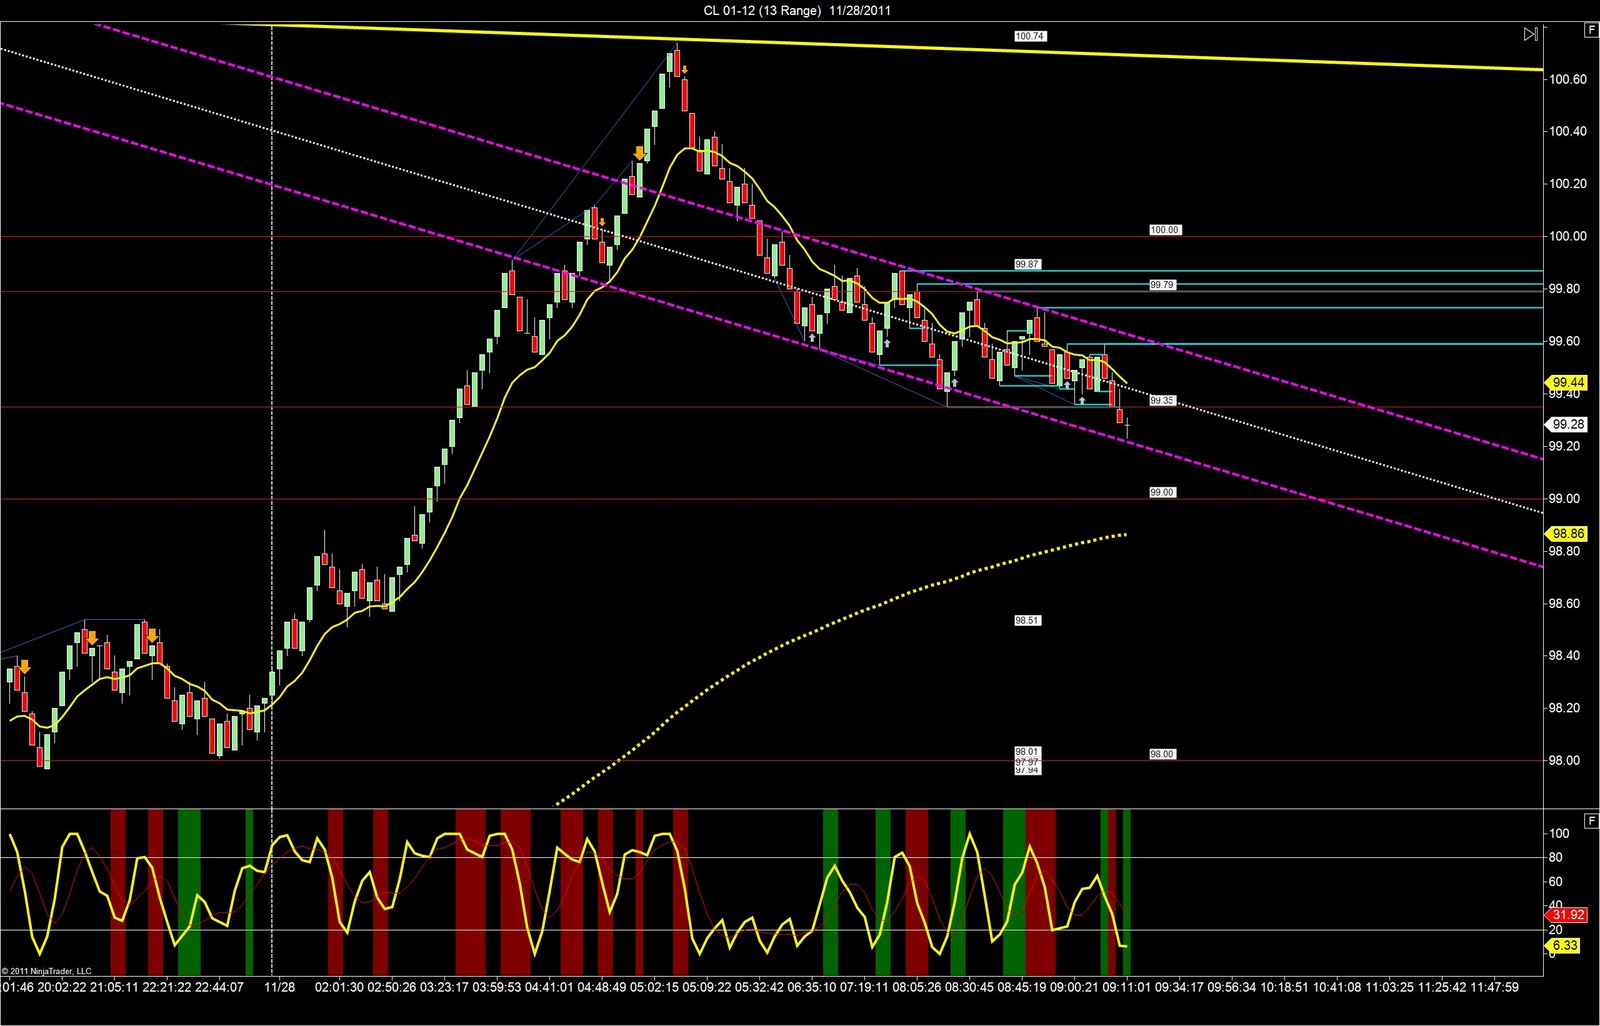
Crude Oil futures are rising up to 100.00 area this morning and this tells us we have two options. Either keep buying pullbacks as price keeps rising up to 103.37 high, or sell the failure below 100.00 and bring it down down to 97.55. The Dollar Correlation will be key to this day trading strategy this morning.

We open our 89range chart on the crude oil, and we see a LOT more clues to work with. We have the MAJOR trigger zone around 95.00 which was tested and held. Now as price rises we’re looking for clues to where the market wants to go next. We’re in the zone from the double-bottom around 95.15 and therefor we have the ‘zone’ which we are current within. We want to wait patiently to see where price goes from here. Above the zone we buy pullbacks up to 101.55, and if we drop below the zone we sell retracements down to 98.57 for the 89range trigger line support, and then down to PHOD 97.55. We want to use the trigger zones below us as price targets for the short side of the trades today. Use the the 102.00 max extension as the target for the long side.

Crude Oil 34range chart shows us the same basic information, but we now see the SPECIFIC price levels where we will be entering long and short today.

We now use the much faster timeframe, 13range chart on crude oil to find the short term trend, and we want to trade with this short term trend. Remember to stay away from selling at the lows of this channel, wait to sell the highs at resistance.
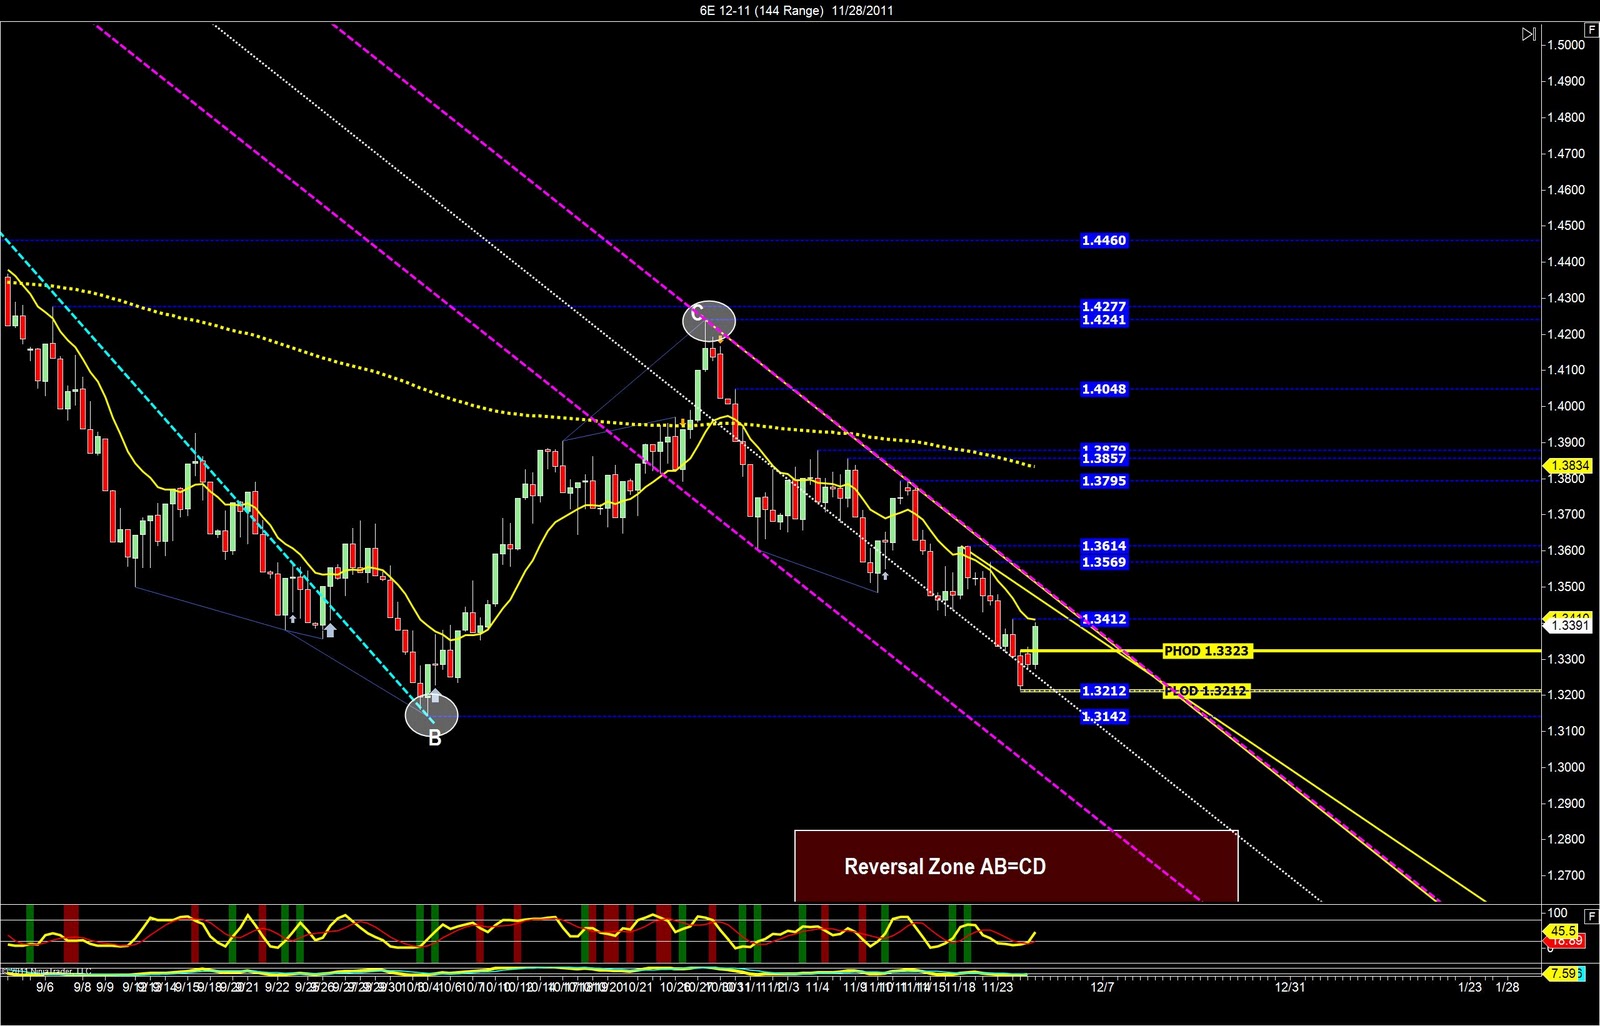
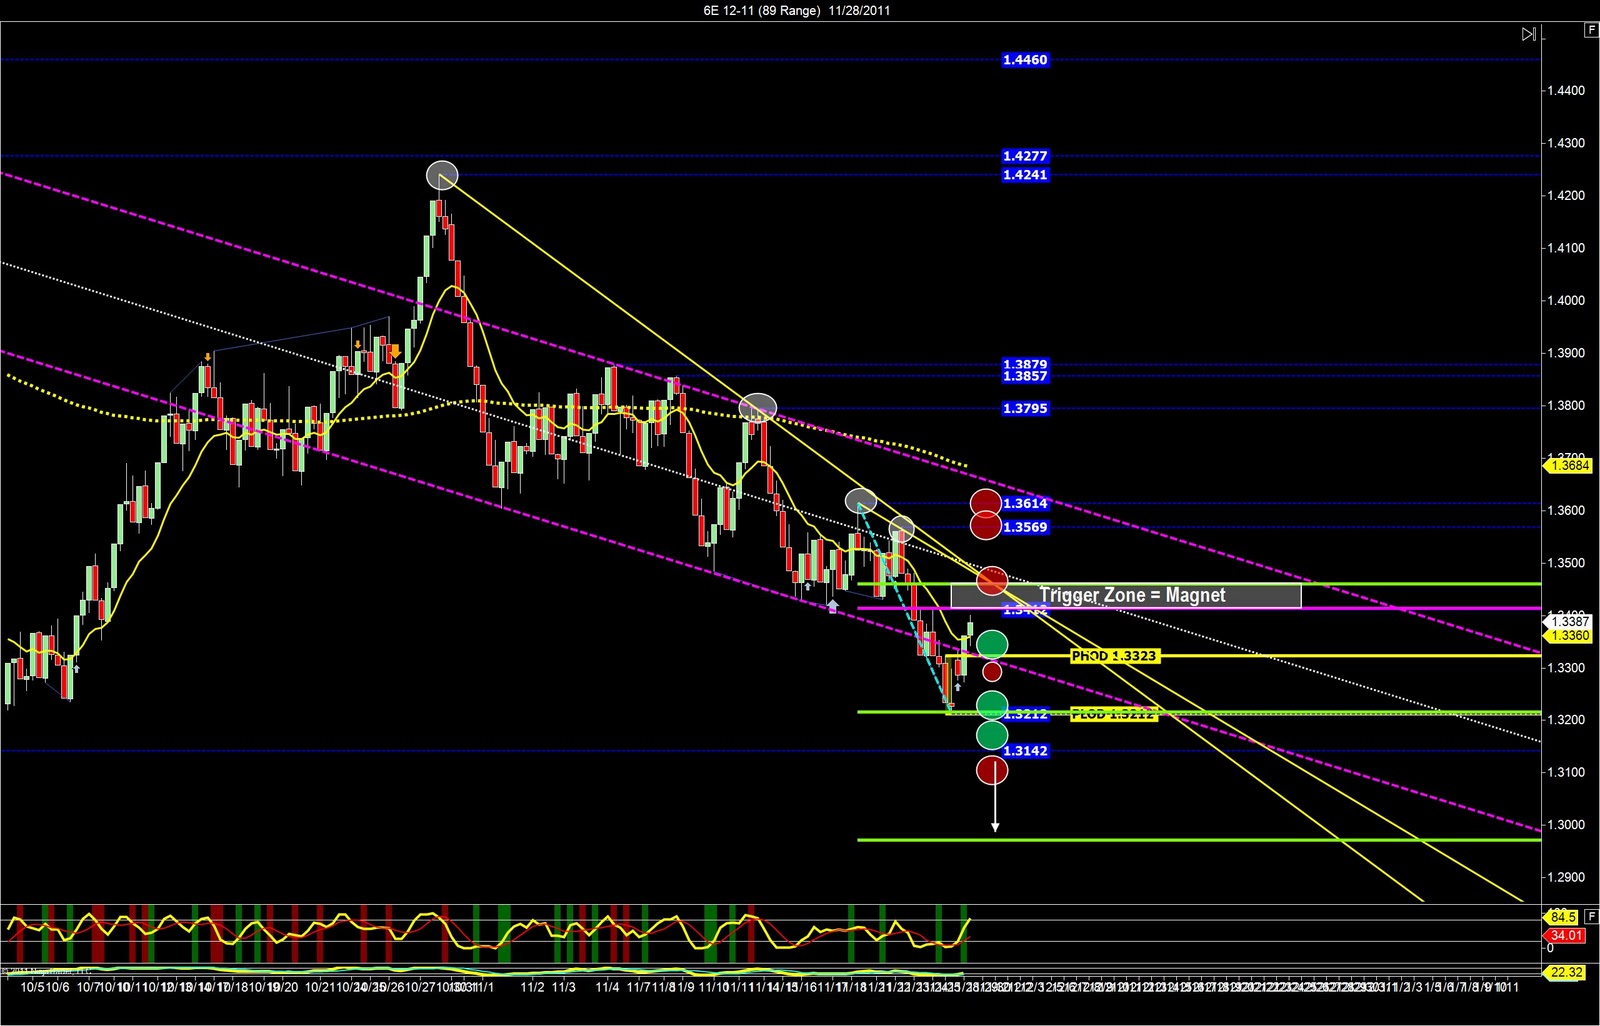
Euro Futures using the 144range chart we see the BIG PICTURE and its amazing how well this AB=CD Pattern trading strategy really works. We know the Euro wants to keep moving lower in this long term trend, so selling new lower lows with retracements.
Euro 89 range shows us much detail, and we know to buy on the way up, and then sell the resistance at the trend lines and the trigger zone around 1.3430 area. if price goes higher we can buy above 1.3500 but then sell the channel highs and the resistance overhead. If price falls we can sell below PHOD however it will be higher risk at the lows of the bear channel.
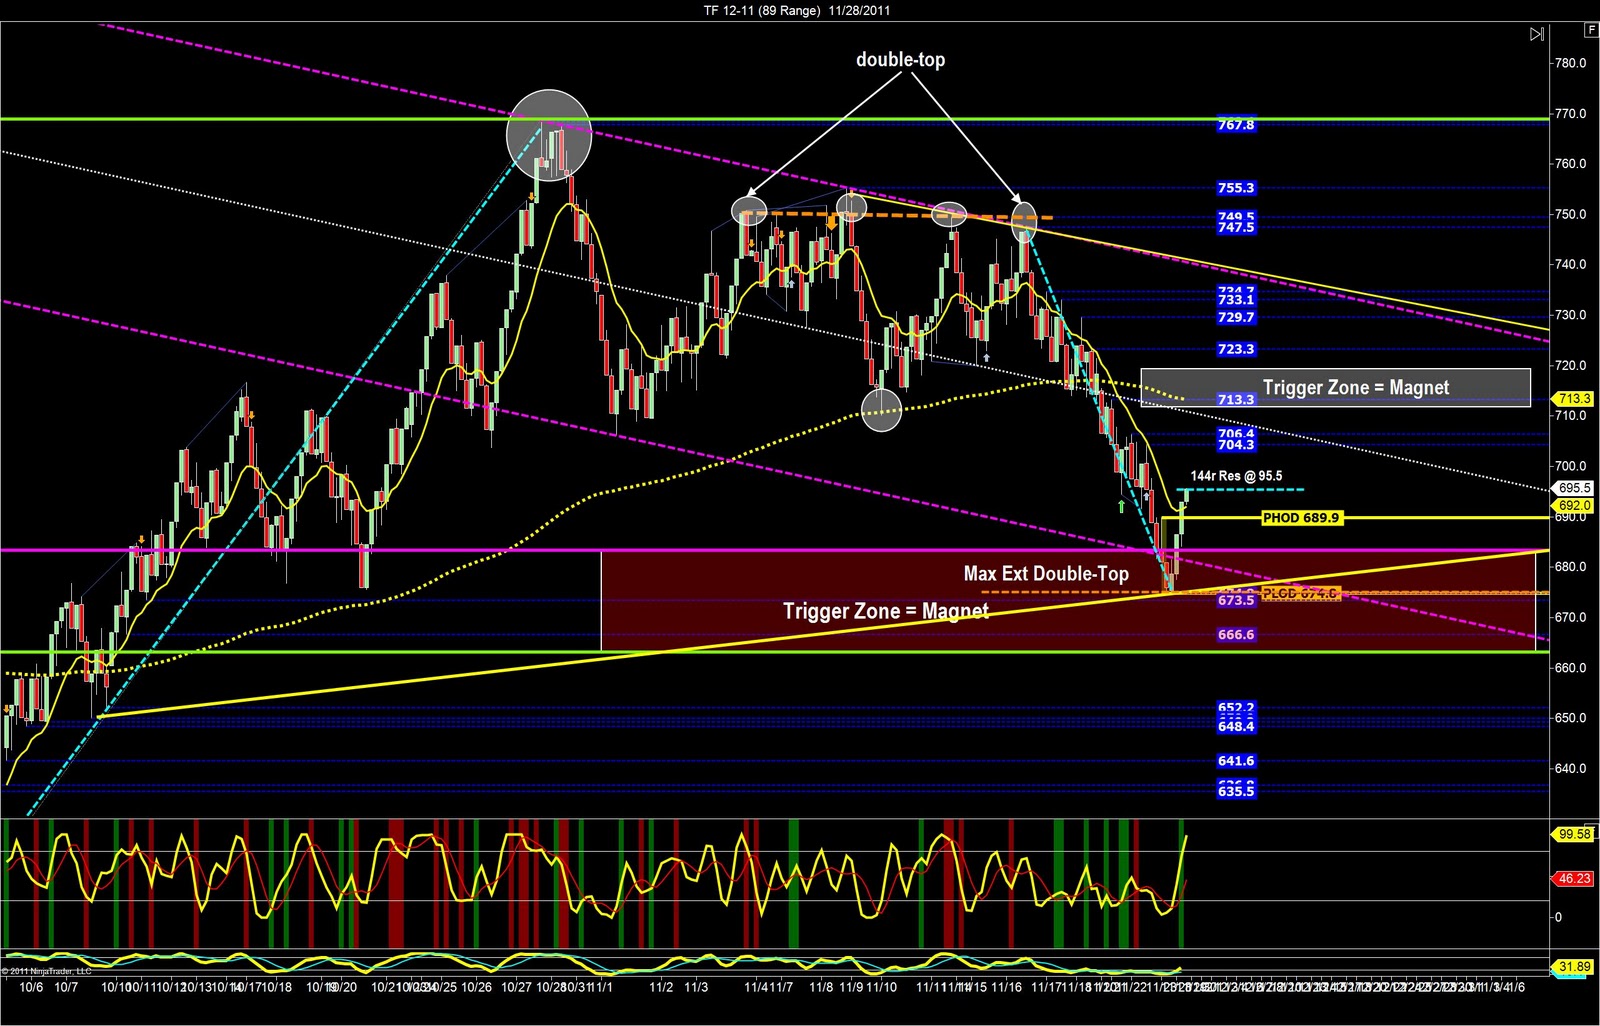
Russell Futures trading at the lows of the bear price channel, and the double-top max extension was recently tested. We need to wait for price to break above 695.5 and then we can buy pullbacks with the targets of 700.00 and 704.3, 706.4. If price fails to move higher we than sell below the PHOD with the final target at the lows of the channel and/or wedge around 681.0

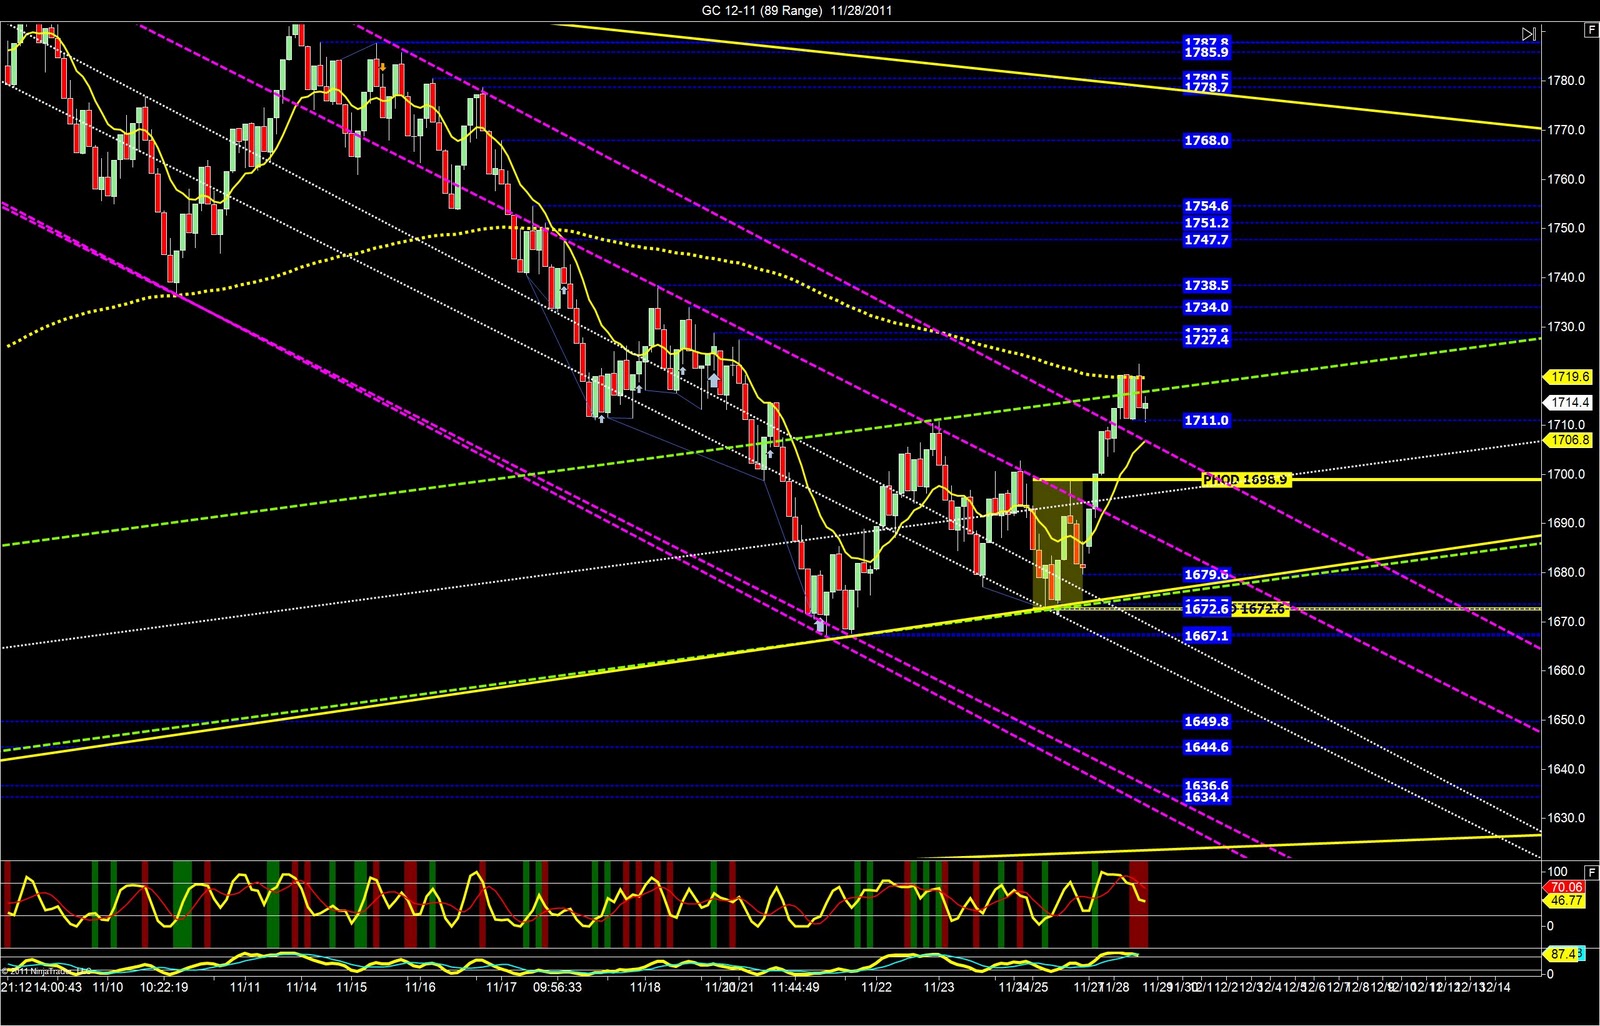
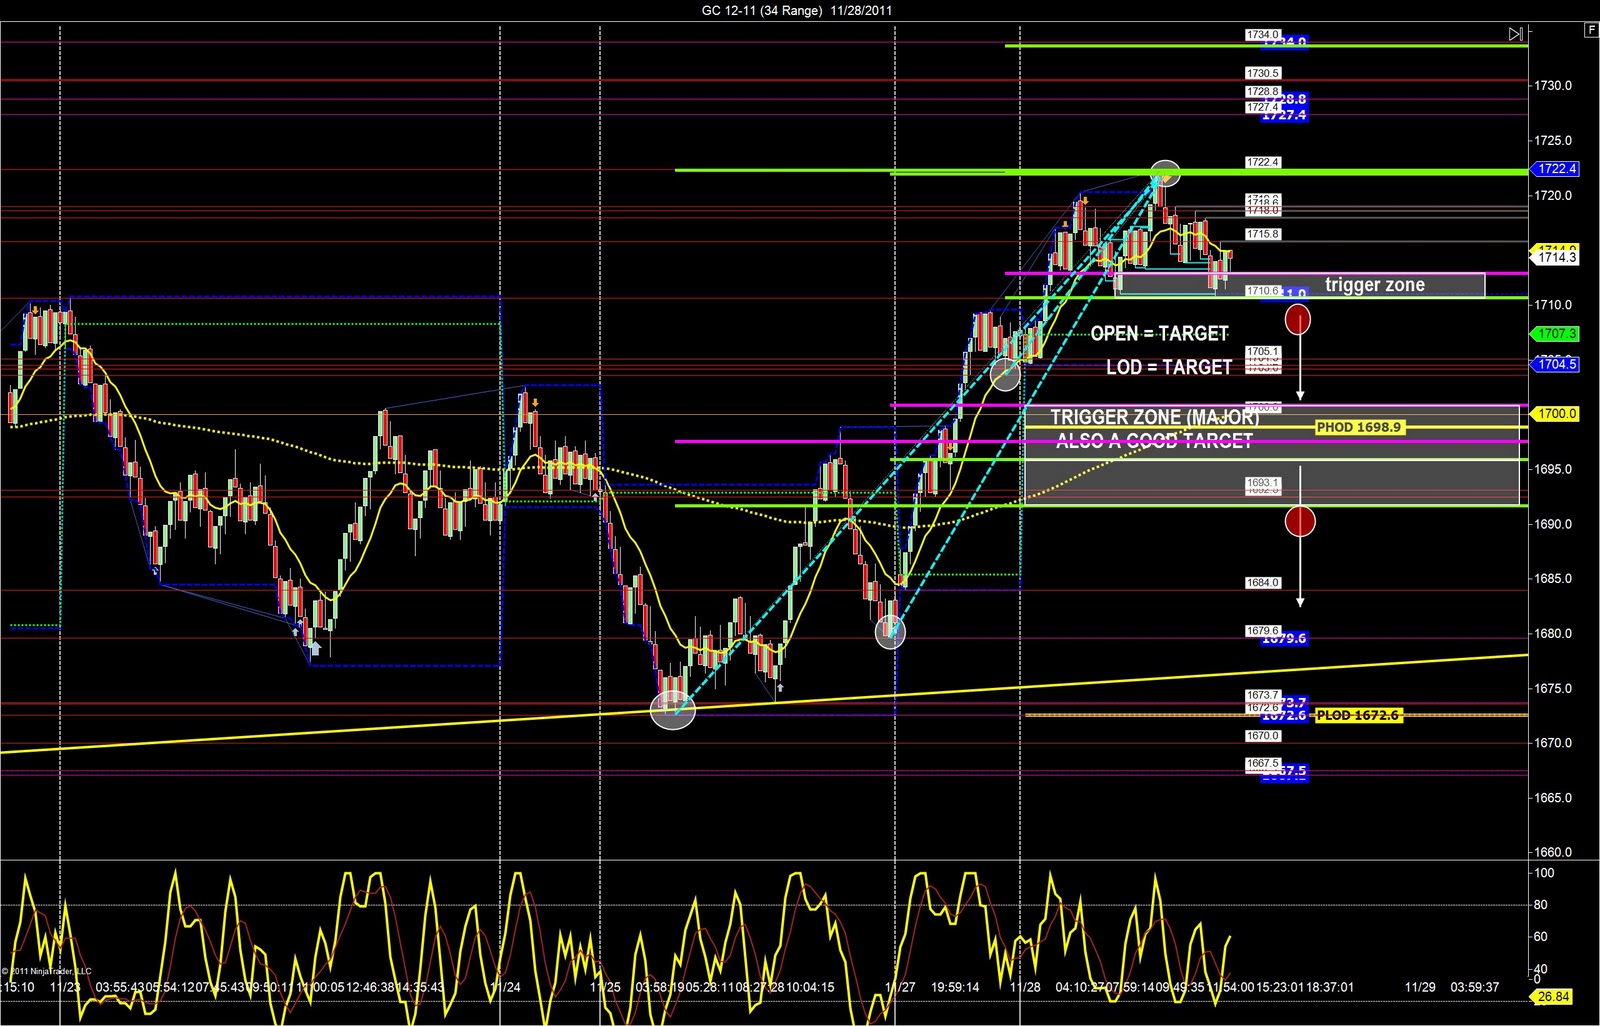
Gold Futures are at the highs of the channel, and we need to wait to sell below 1710.6 below the 34range trigger zone.