- in Uncategorized by schooloftrade
day trading strategies for dollar index, crude oil, gold, euro and russell futures

The dollar index is an important correlation tool for us, and we use the DX to find the major turning points in the market, which will help us make educated trading decisions.
Our Dollar Index 89range chart shows us inside the range from Monday, at the highs of the bull channel, and most importantly, recently tested the trigger zone, and moving higher. This tells us there is a very high potential for the dollar to test the 79.530 area, which is rising dollar, which tells us to be selling the markets we trade most.

The Euro Futures 89range chart trading in a bear channel, inside the range from monday, and has recently tested the trigger zone resistance overhead. This market wants to go lower, and if we break below the PLOD and the Dollar Index keeps rising, we will be selling retracements down to 3212 and 3142. If price rises im selling the highs of the channel and the PHOD. If price keeps moving higher through the highs of the channel we will only buy above 1.3445.

We move faster to the 13range chart of the dollar index, and we see a lot more detail in the price action. We see a bear price channel, a price wedge, inside day, and we are in the middle of the channel, so beware. We want to trade when the dollar index is at major turning points, such as the wedge highs and wedge lows.

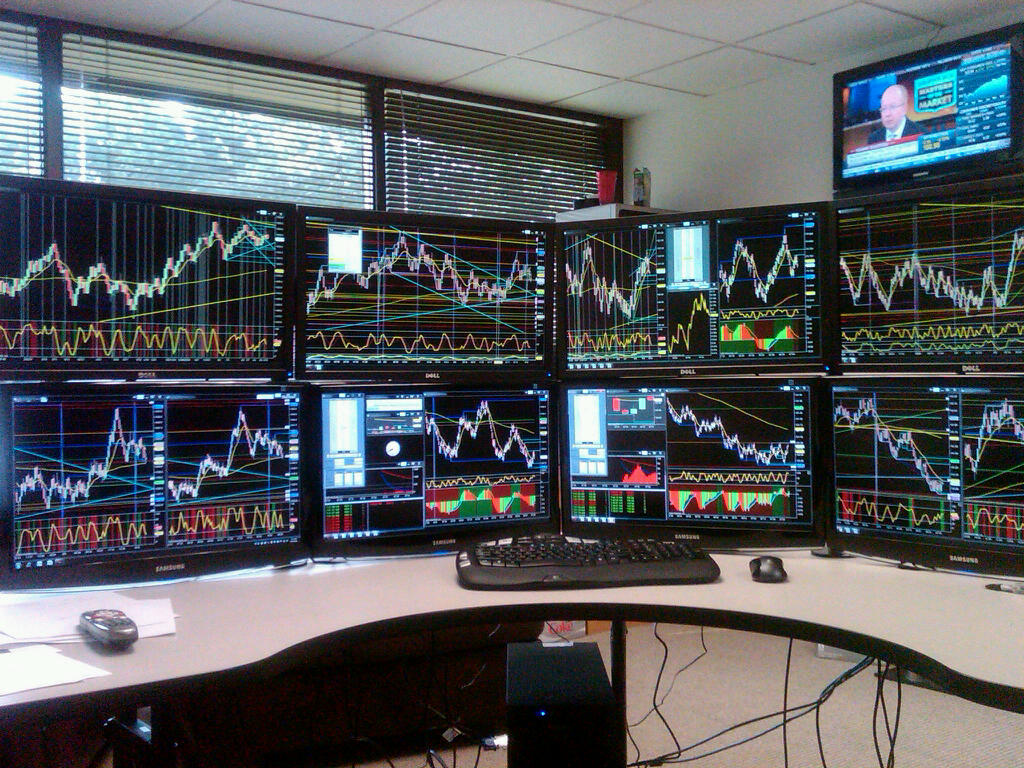
Very cool trading room! thanks Steve for sharing!!
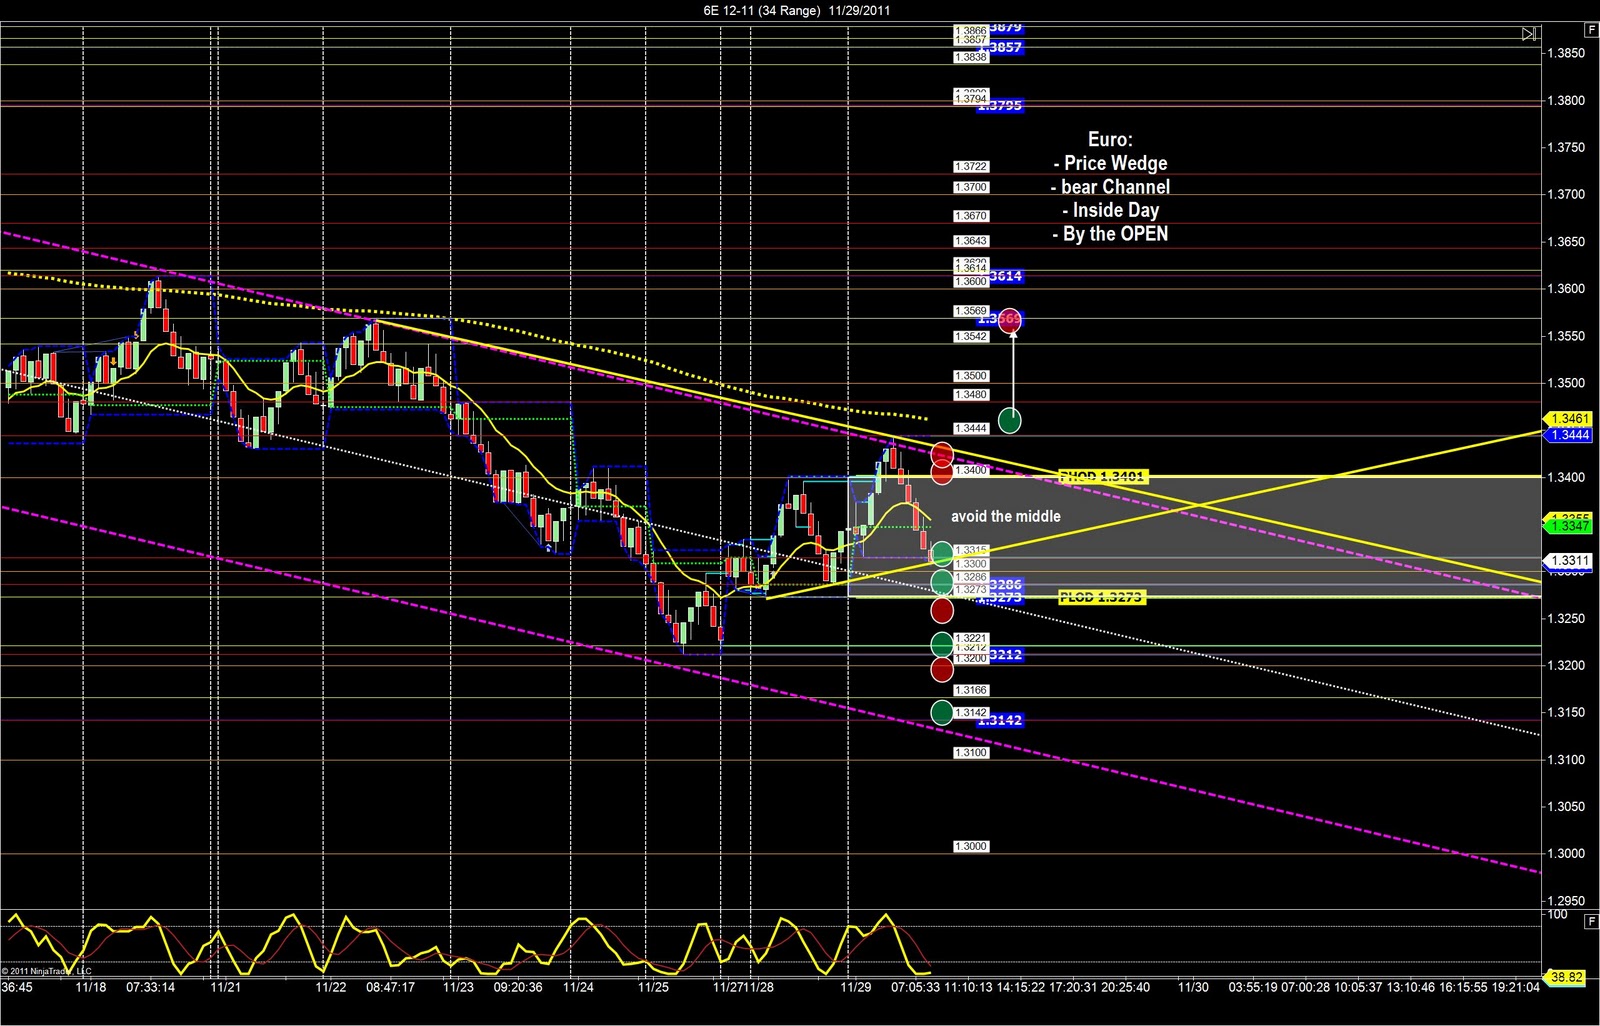
The Euro 34range chart shows us a lot more detail, and we can plan our attack with more specifics. as price falls im buying the lows of this price wedge, and then selling below the PLOD. If price rises im selling the channel highs and then buying above the trigger zone above 1.3445
The Euro 21 range chart shows us more details and we use this to plan our trading this morning. As price falls with the dollar index rising we need to be careful selling short until we get below the 1.3273. Buy the wedge lows as the higher percentage trades at this time.

Crude Oil futures trading in a very common price structure, with a price wedge and inside the range from monday. this tells me the personality traits that we will use for our day trading strategy. Buy the lows, sell the highs, avoid the middles, and remember the dollar correlation is telling us to look for the dollar to RISE, so we can SELL on the crude oil.

The Russell Futures 89range chart shows us bouncing off the trigger zone and max-extension support from the double-top, and then it FAILED above the PHOD. The failure of the buyers above the PHOD tells us to sell the drop back below the PHOD.

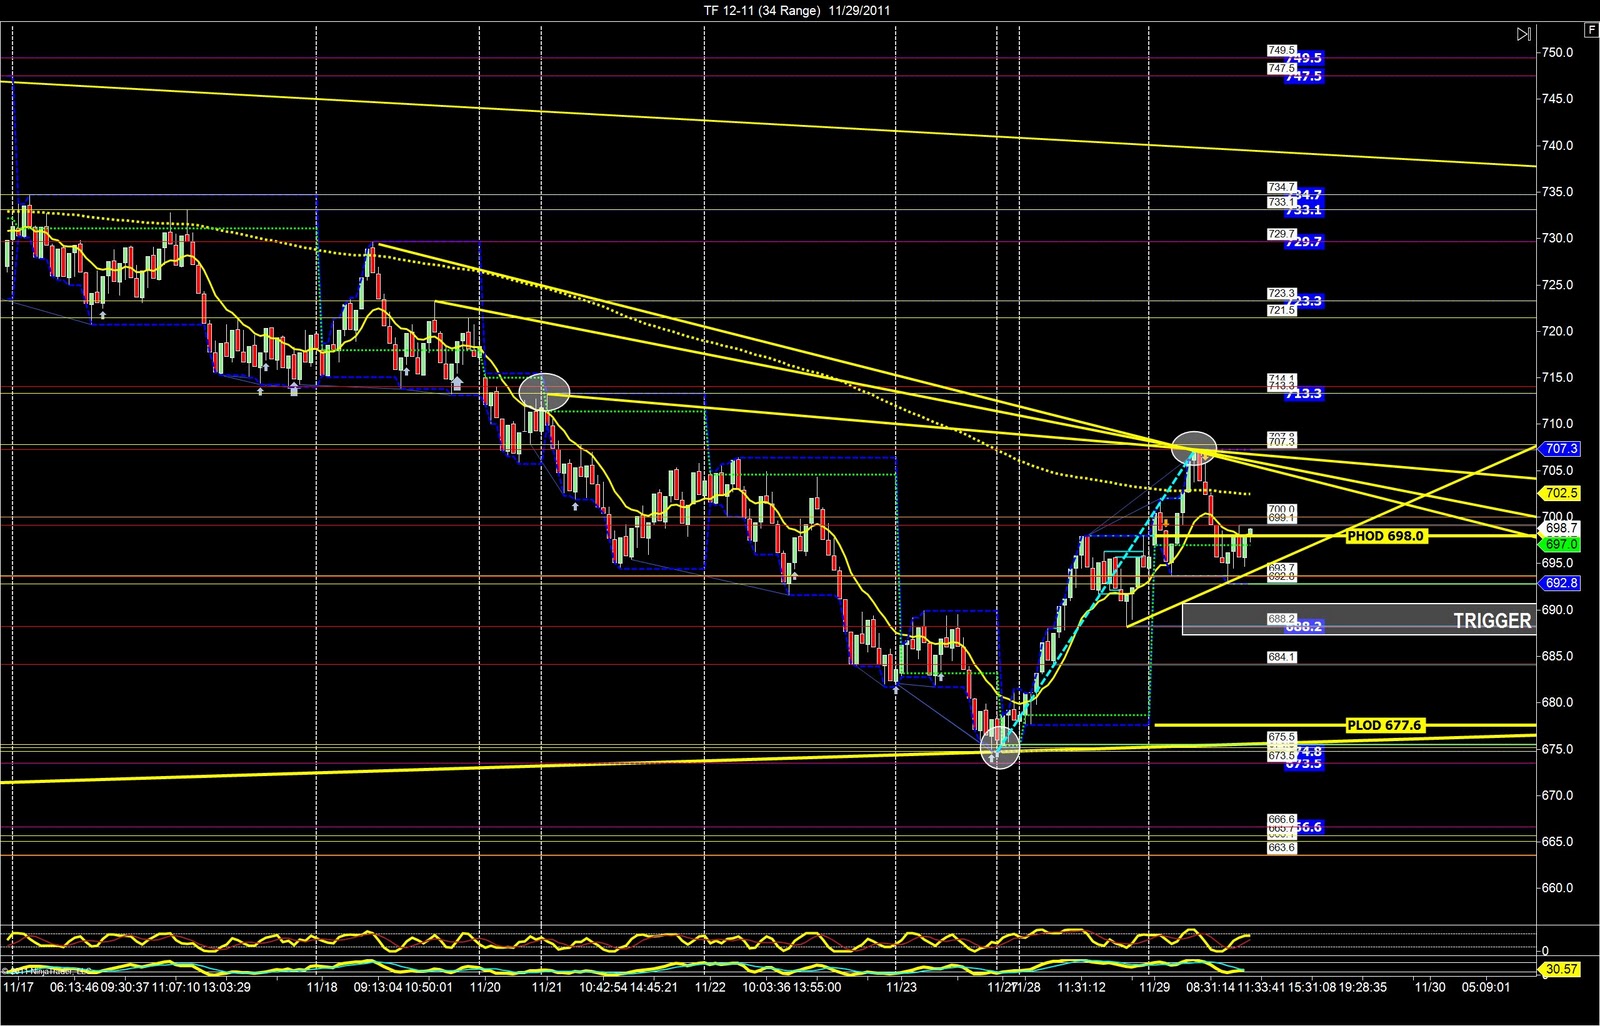
The Russell Futures 34range chart shows us a price wedge, and trading around the PHOD and the OPEN. Buy the lows, sell the highs, and avoid the 700.00 big round number.
Crude Oil 34range chart shows us the bull price channel, the double-bottoms, and the trigger zone. If price rises sell the resistance overhead at 99.79, and then buy a pullback if price keeps going higher with the 100.00 as the target. Then sell the wedge highs above the 100.00. If price drops selling the max extension from the double-bottoms, and price should come all the way back down to re-test the OPEN @ 97.65 area.
