- in Uncategorized by schooloftrade
Day Trading Strategies for Dollar Index , Euro, Crude, Russell and Gold futures
The Dollar Index is where we being our trading day this morning, and our trading strategy takes advantage of the negative correlation with the US Dollar Index looking for major turning points in the market each day.
The Dollar Index this morning on the 89range chart is showing the major zone below us, the minor above us, and we are stuck in the middle. We know the best use of the dollar index is to use it around major turning points and we are in the middle at this time, so be patient.

We need to stay patient this morning with the dollar index trading at the BMT in the middle of the range and looking like the short term bear channel may be coming to an end. I am going to sit on hands until this dollar index makes a new higher high or lower lows.

The Euro 89range chart is trading in a bear price channel, a price wedge, and inside day. The bear channel tells me the shorts are likely to be higher percentage today. The Inside day and the price wedge both tell me to sell the highs and buy the lows of the range. The hardest part of the euro day trading strategy this morning is waiting.

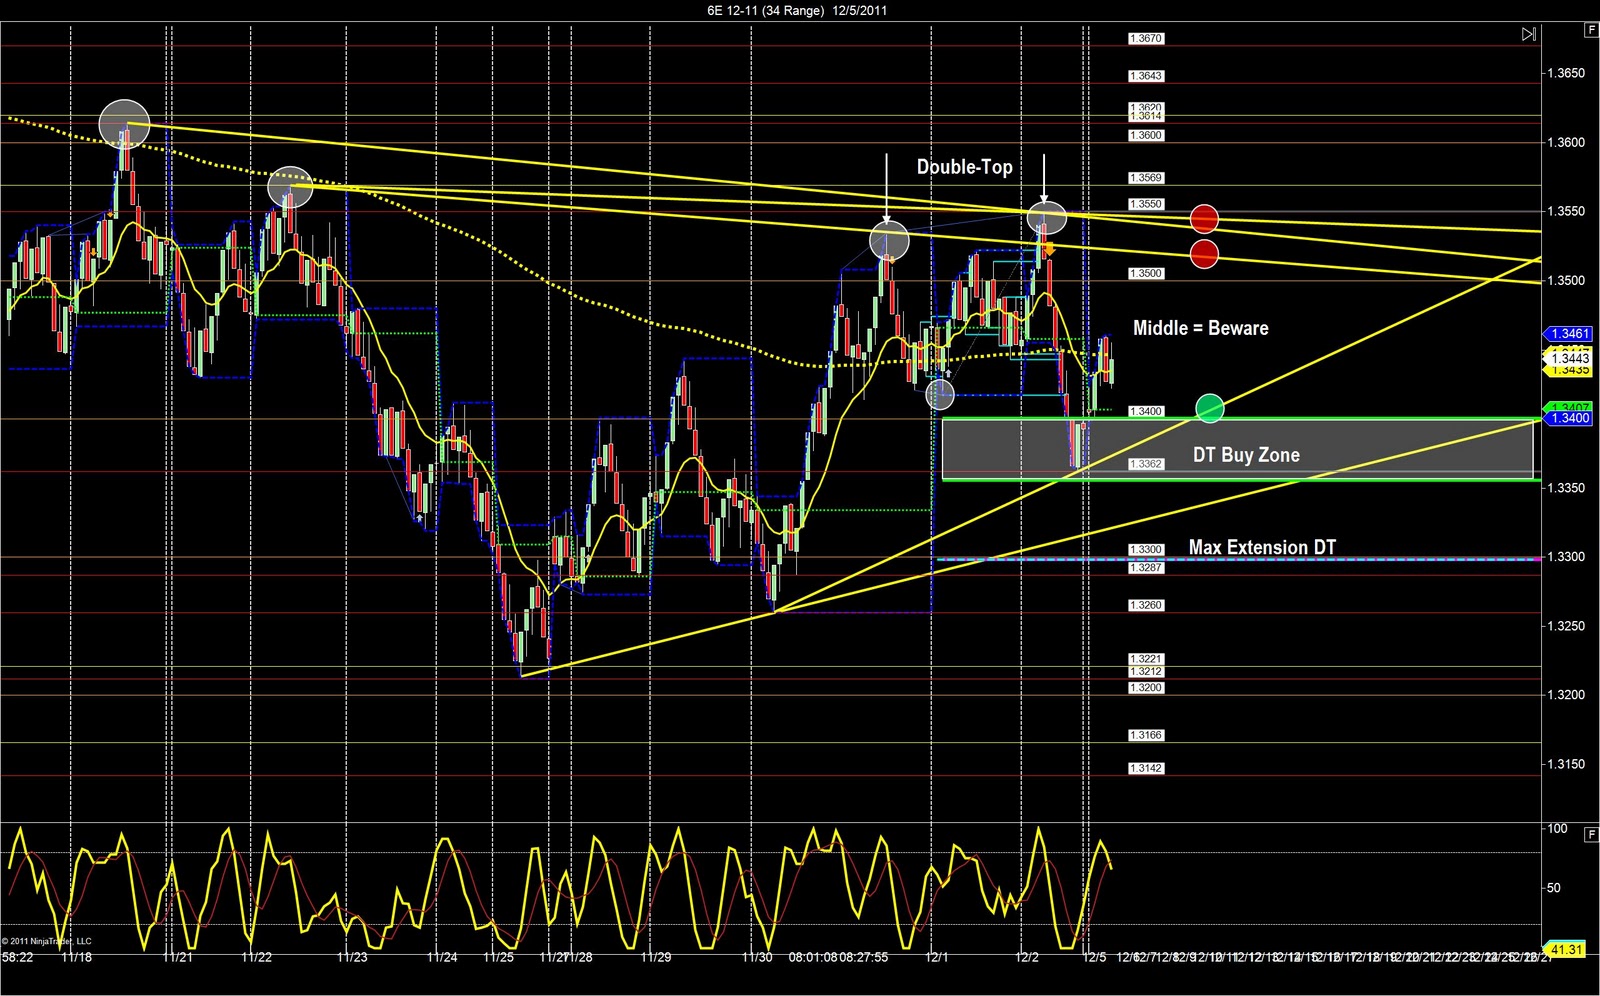
The Euro 34range chart shows us the same price wedge, along with a new double top which gives us the buy zone and the max extension as major SUPPORT levels below us. Remember to avoid the middle, buy the lows, sell the highs, and use the dollar correlation as best you can.
The euro fast timeframe my 13range chart shows me a short term bull price channel, the opposite of the dollar channel, is broken and trading sideways. This tells me I need to wait and sit on hands to see new higher highs or new lower lows before I start trading the euro.

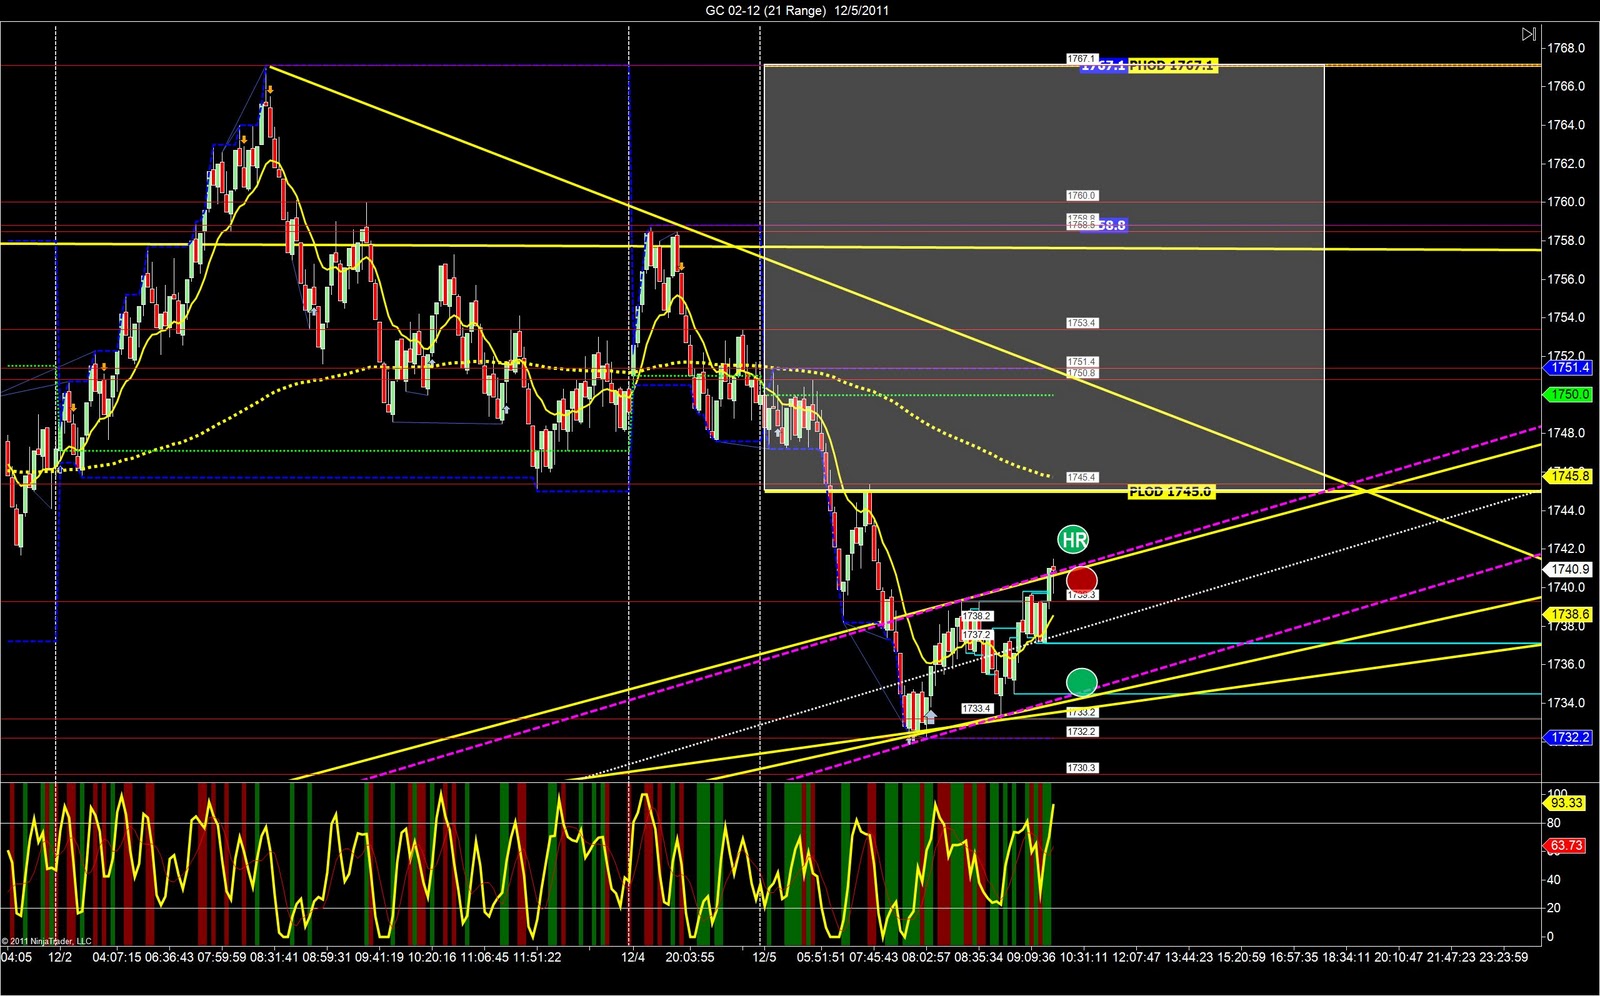
Gold Futures trading in a strong bullish price channel outside the range from Friday, in the trigger zone support using the swing lows to swing highs, and the dollar index correlation telling us to be a buyer right now. If price rises im buying pullbacks off the channel lows and then buying more above the PLOD. If price makes it up to the highs of the range I am selling the channel highs and the resistance levels at 58.8, 67.1, 73.4 as we rise. If we fall im buying at support, and then if we break the trigger zone lows at 28.5 we then sell off down to the next trigger zone below us, where we will take profit and look for more opportunity higher or lower.

The Gold 34range chart shows us the same bullish price channel, along with the price wedge, the double-top and the outside trading day, below the PLOD. We want to buy the lows of the channel, buy the lows of the wedge, and use the dollar correlation along with the Max Extension from the double-top as our guide to buy here. Looking to buy Gold above 1740.0 with a final target of 1745.0. If we break above the PLOD 1745.0 we then buy pullbacks with the final target above the PLOD as the OPEN and the wedge highs.

Gold 21range chart shows us a bull price channel so we want to buy the lows, sell the highs, avoid the middle, and be careful buying a pullback above the channel highs as we expect a fake-out breakout above the highs.
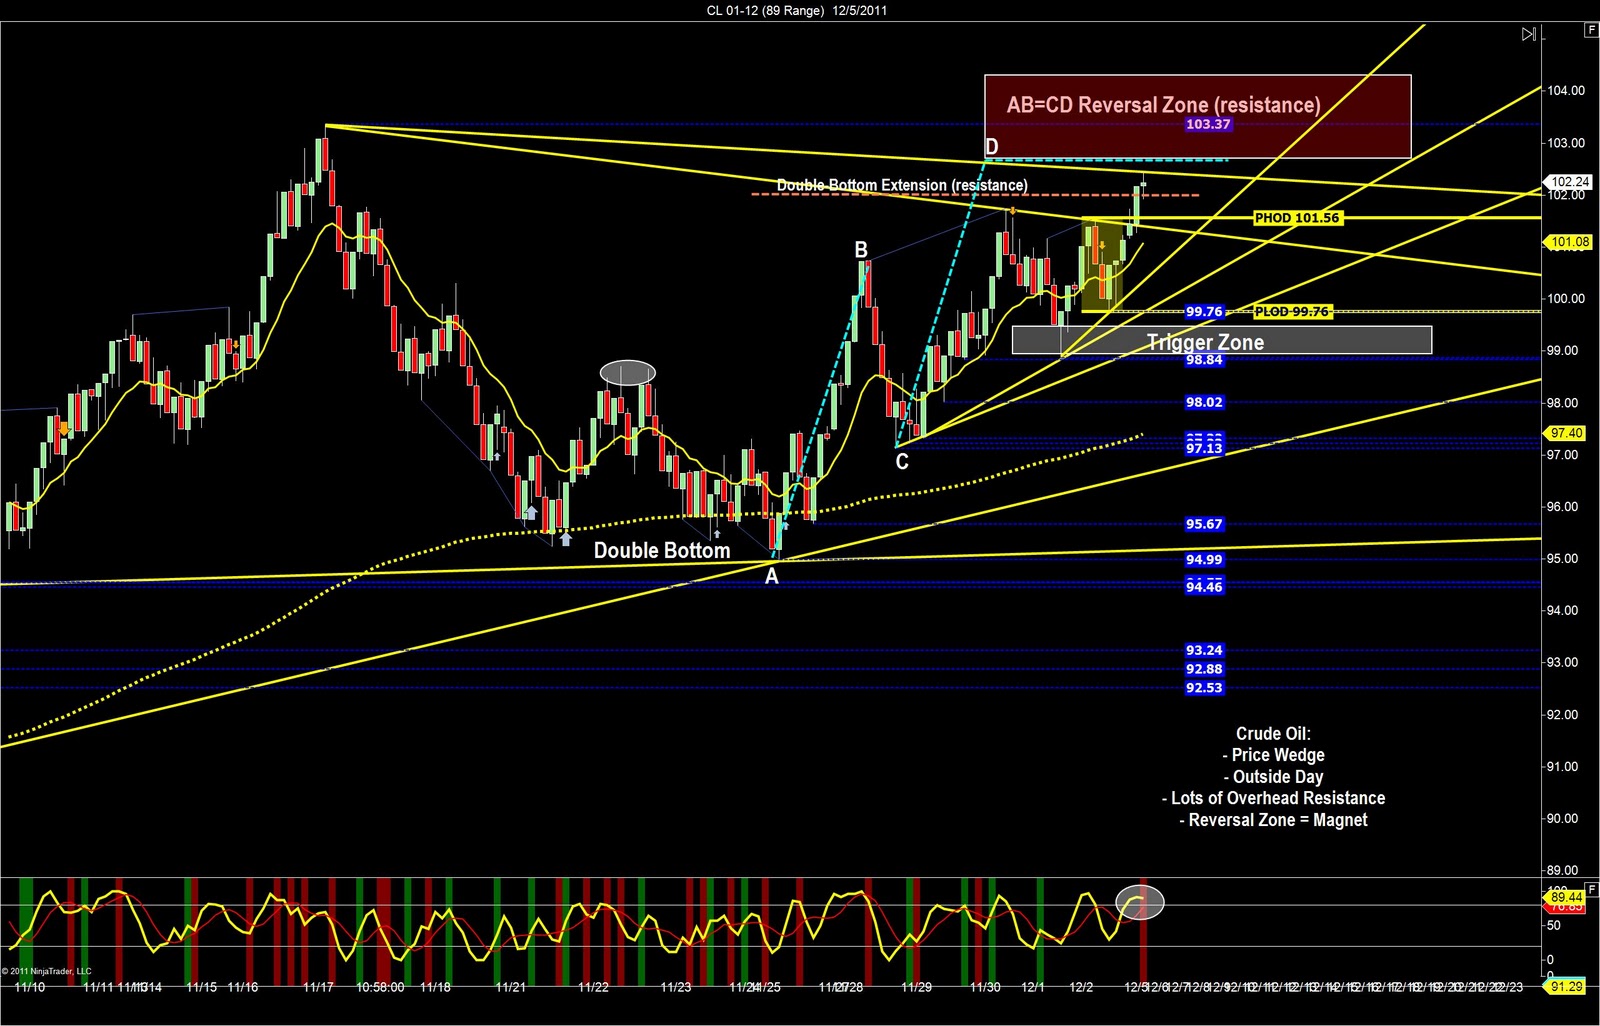
Crude Oil 89range chart shows me the outside day, the price wedge, the max resistance levels from the previous double bottoms, so i want to sell as price rises to overhead resistance. Short term I can buy pullbacks above the 102.0 Max Extension, but long term I would rather be patient and wait to sell. I can trade both directions however, I would rather be a seller considering the wedge, and then If the dollar index keep falling I will have no choice but to buy a pullback and buy along with rising prices.
Crude 34range chart shows the new bull channel and the outside day, nothing more then we found on the slower timframe with the 89range chart.

The crude 21range chart shows us the 2step pattern short to sell the highs.
