- in Uncategorized by schooloftrade
Day Trading Strategies for Dollar Index , Euro, Crude, Russell and Gold futures

Our day trading strategy uses the dollar index for a correlation, and the day always begins with the review of the dollar index.
The 89range chart shows us the bull price channel, the trigger zone, and we are inside this trigger zone, which means we need to wait for the price to move higher or lower to confirm the long term direction. If the dollar moves higher above the ‘zone’ this is nothing more than a pullback and the DX will rise up to the PLOD. If we go below the ‘zone’ we know that the sellers are too strong, and we will re-text the channel lows. Inside the zone, price can move up and down, above the zone is bullish, and below the zone is bearish.

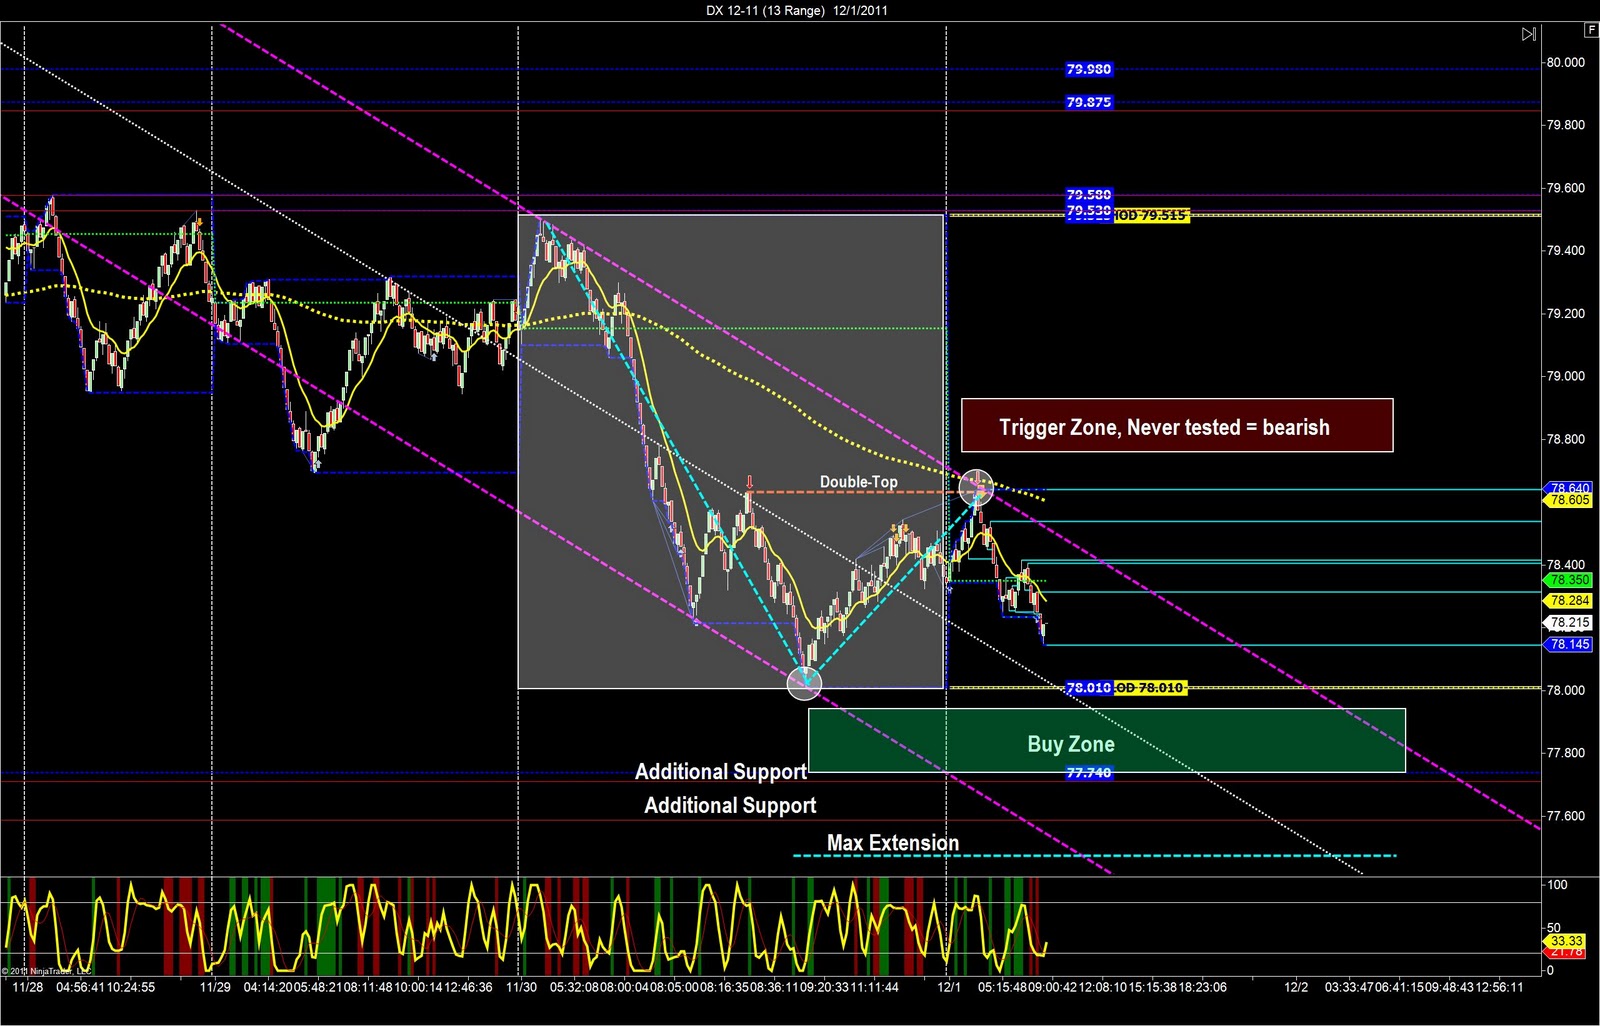
The Dollar Index 13-range chart show us an inside day from wednesday, a bear price channel, and most importantly the short term trend. Bear channel tells us directional bias, so selling the dollar index we want to be BUYING on the crude, gold, euro, russell, etc. The Buy zone below us gives us both a target for the price to keep moving to, and a major support where we will expect the dollar to reverse. So we can use the buy zone to tell us to keep buying while the dollar keeps falling, and then when we get into the buy zone we will then look to SELL the markets we trade most as the dollar is expected to rise.
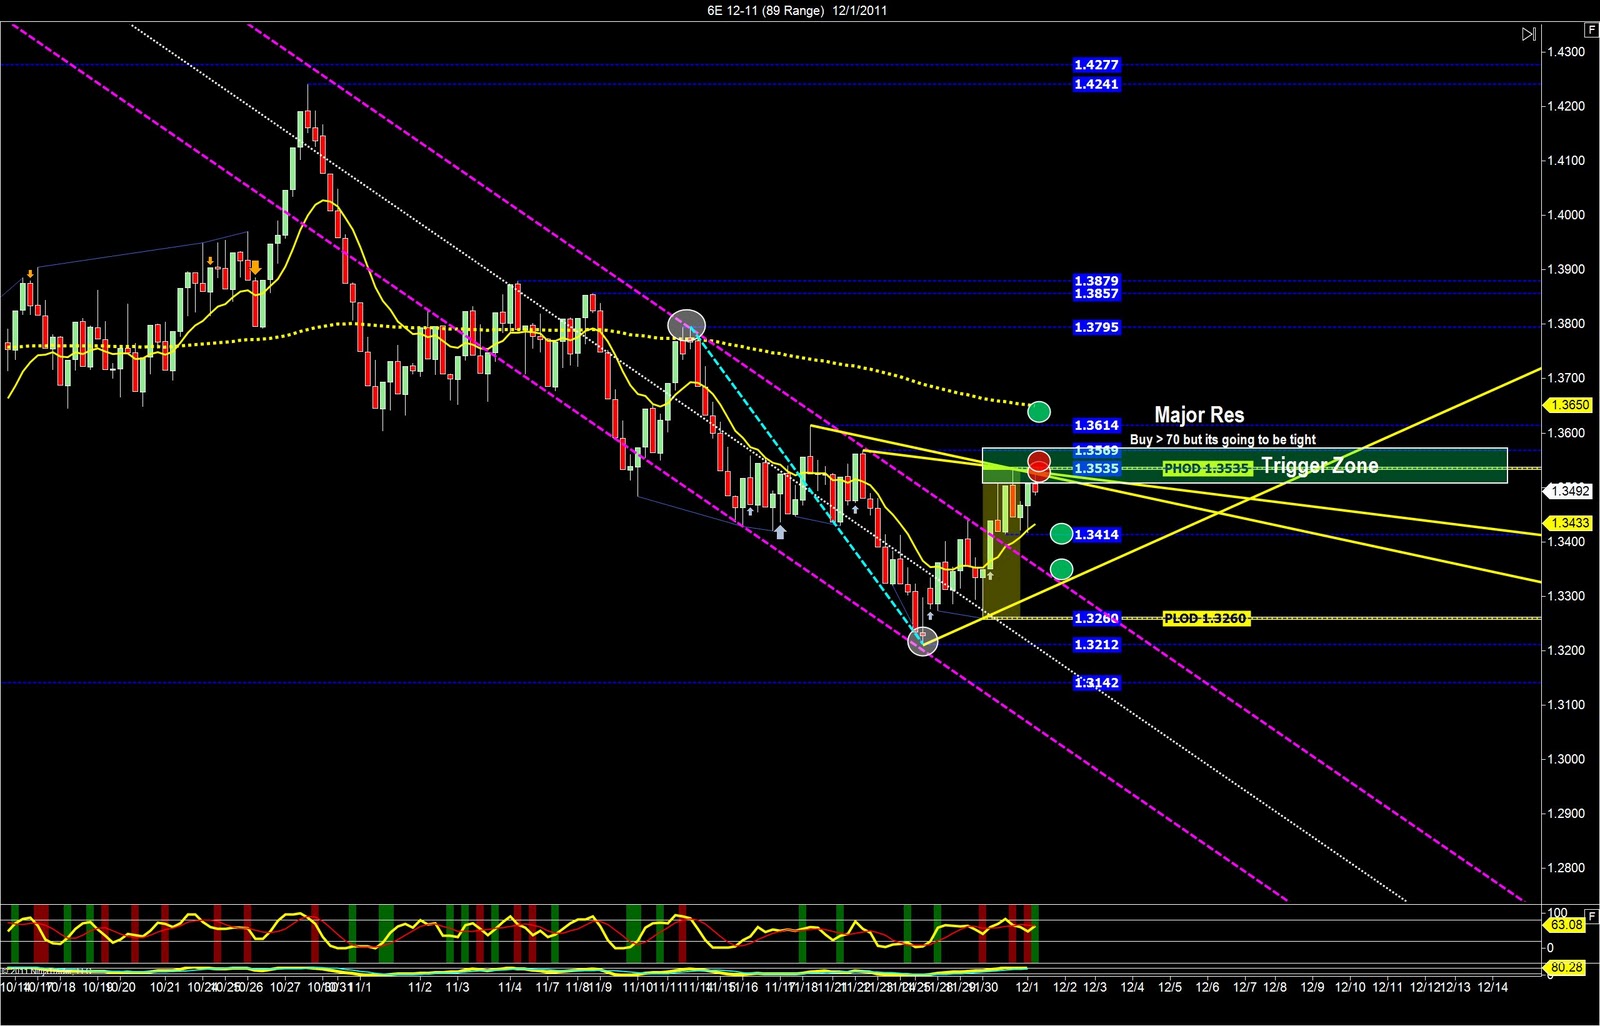
The Euro currency futures are trading in a bear channel, which is recently broken, and a price wedge, at the highs of the range from wednesday. The dollar is moving lower this morning so we look to buy the euro, but we cant until break above the trigger zone and 1.3570. We need to sell these highs first, so look for the dollar index to stop falling, and go sideways before we can really sell these highs.
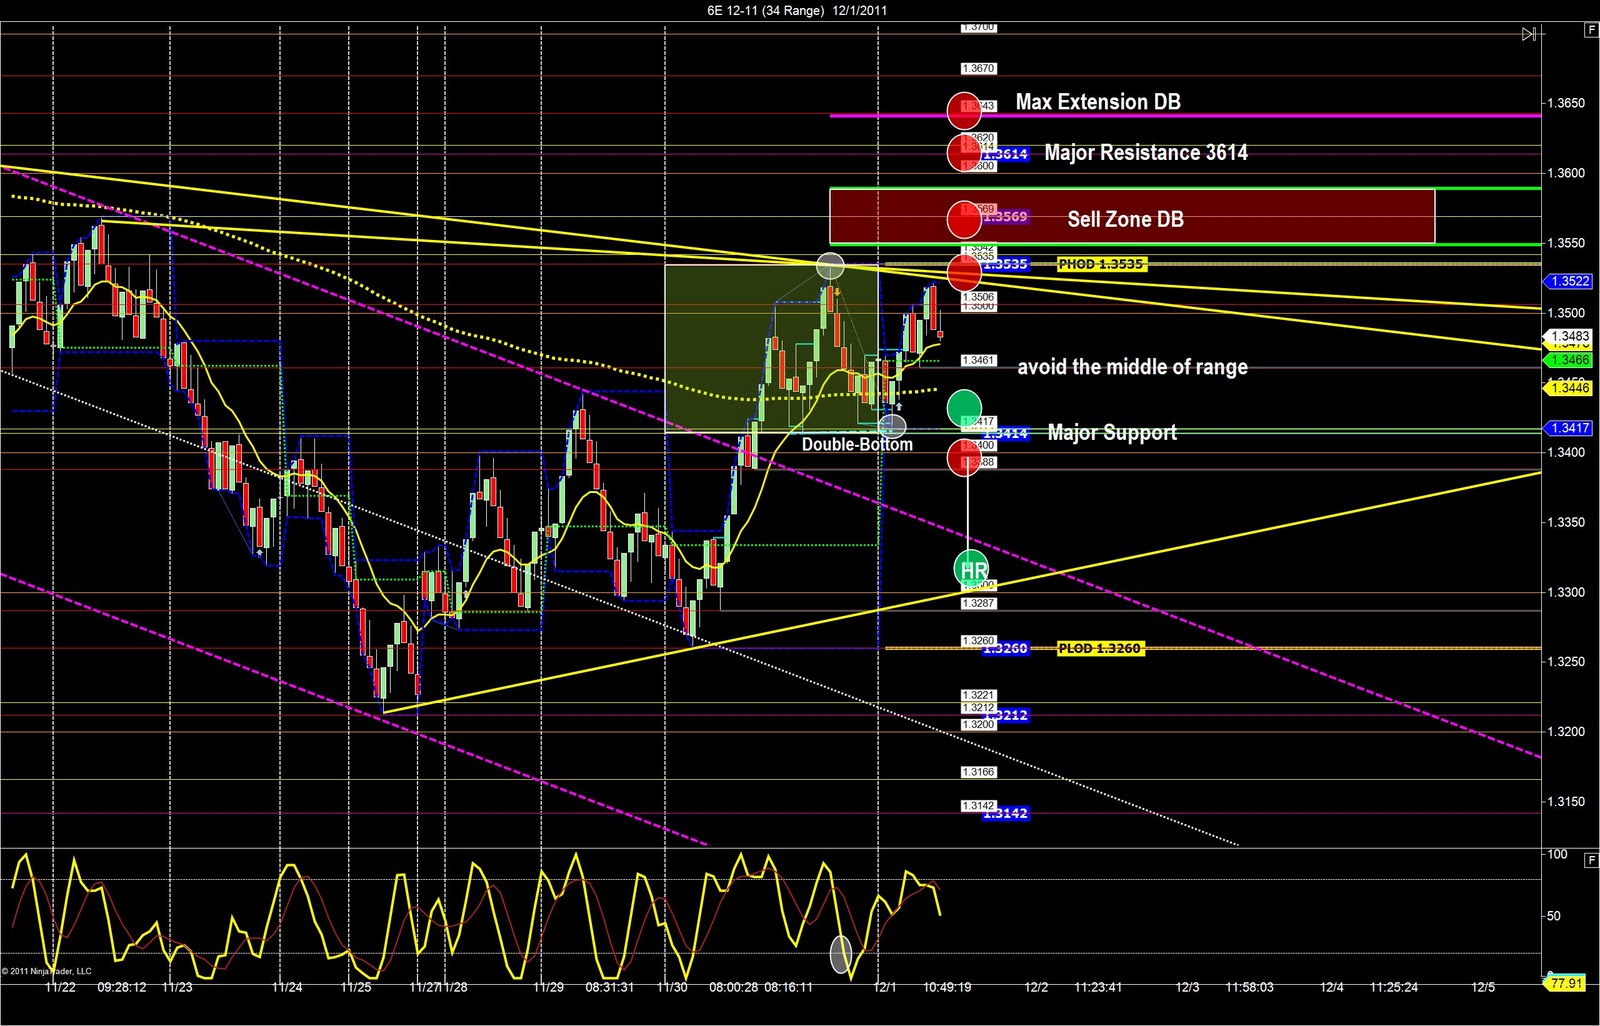
Euro 34-range chart shows us the double-bottom, which tells us where price is likely to go, and then where we want to be selling overhead at resistance. The double-bottom also tells me where the major support is, so if we rise higher im selling at the highs of the wedge and the sell zone, and if price moves lower I will buy the 3417 support, and then sell retracements below the 3417.
The Euro 21-range chart gives us even more info on where we need to be looking for trades this morning. We began with the slowest timeframes and now we have the faster timeframes telling us EXACTLY where to look for opportunities.

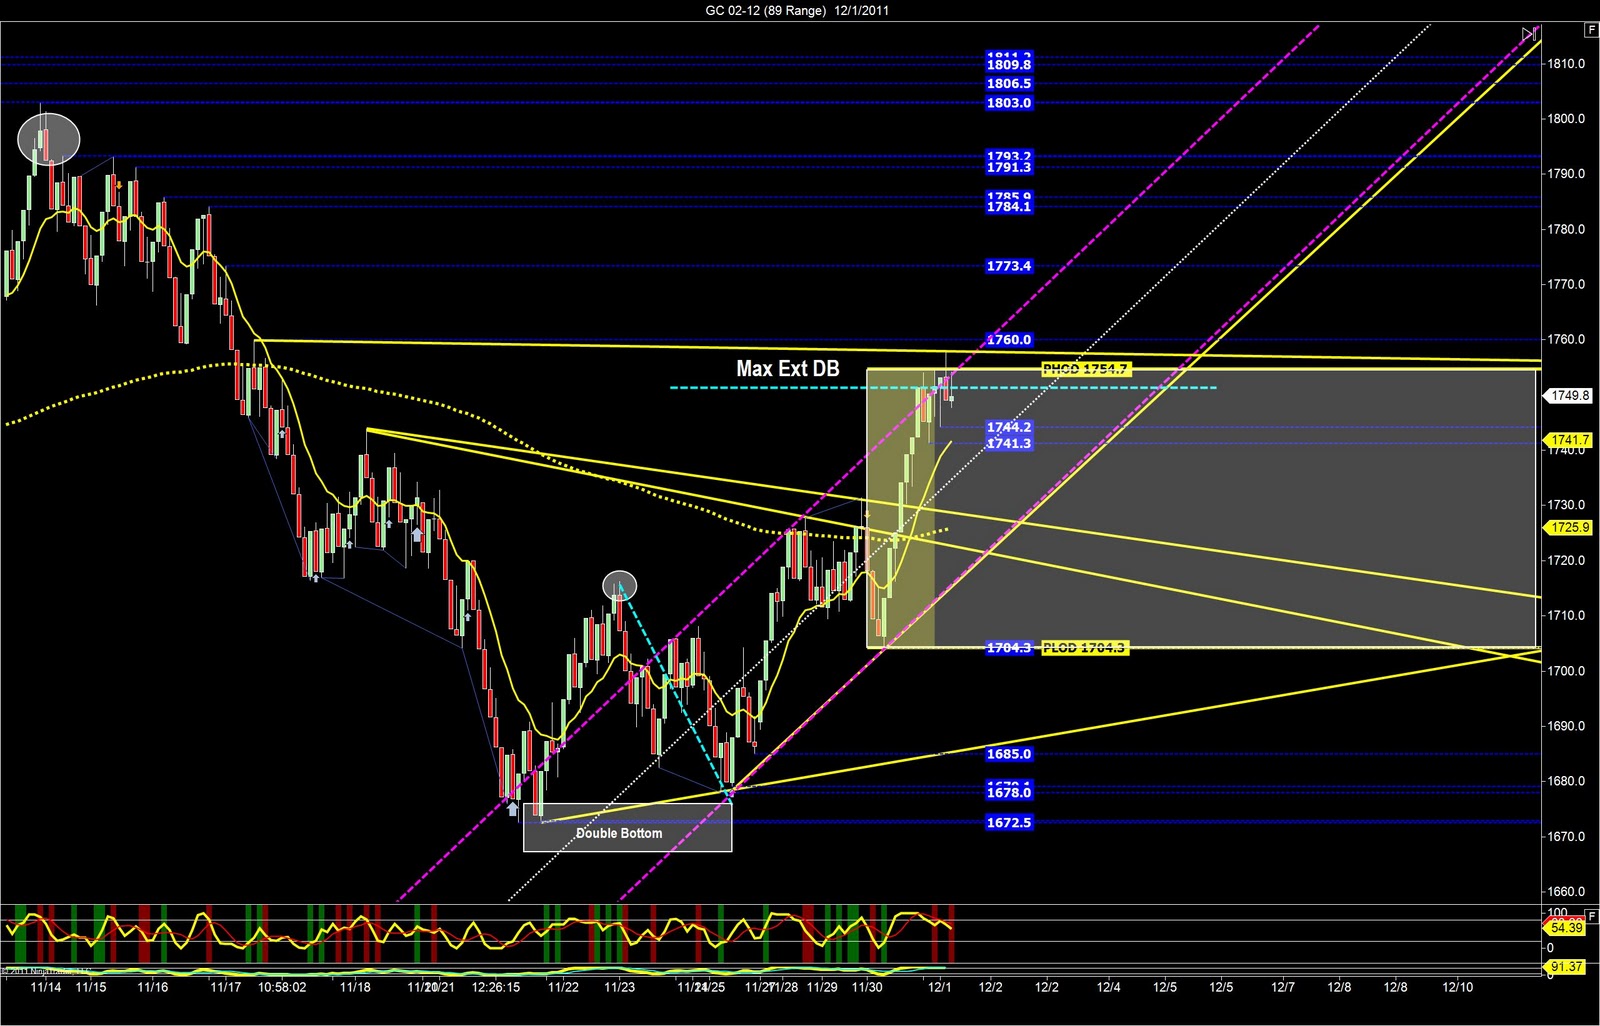
Gold 89-range chart shows us the bull price channel, the double-bottom, and the major resistance at these highs. The Dollar Index has been falling the past 48 hours so the highs of this gold market are being tested. We need to stay focused on looking for short term selling opportunities at these highs, and then if price goes above 1760 we can start buying pullbacks again.
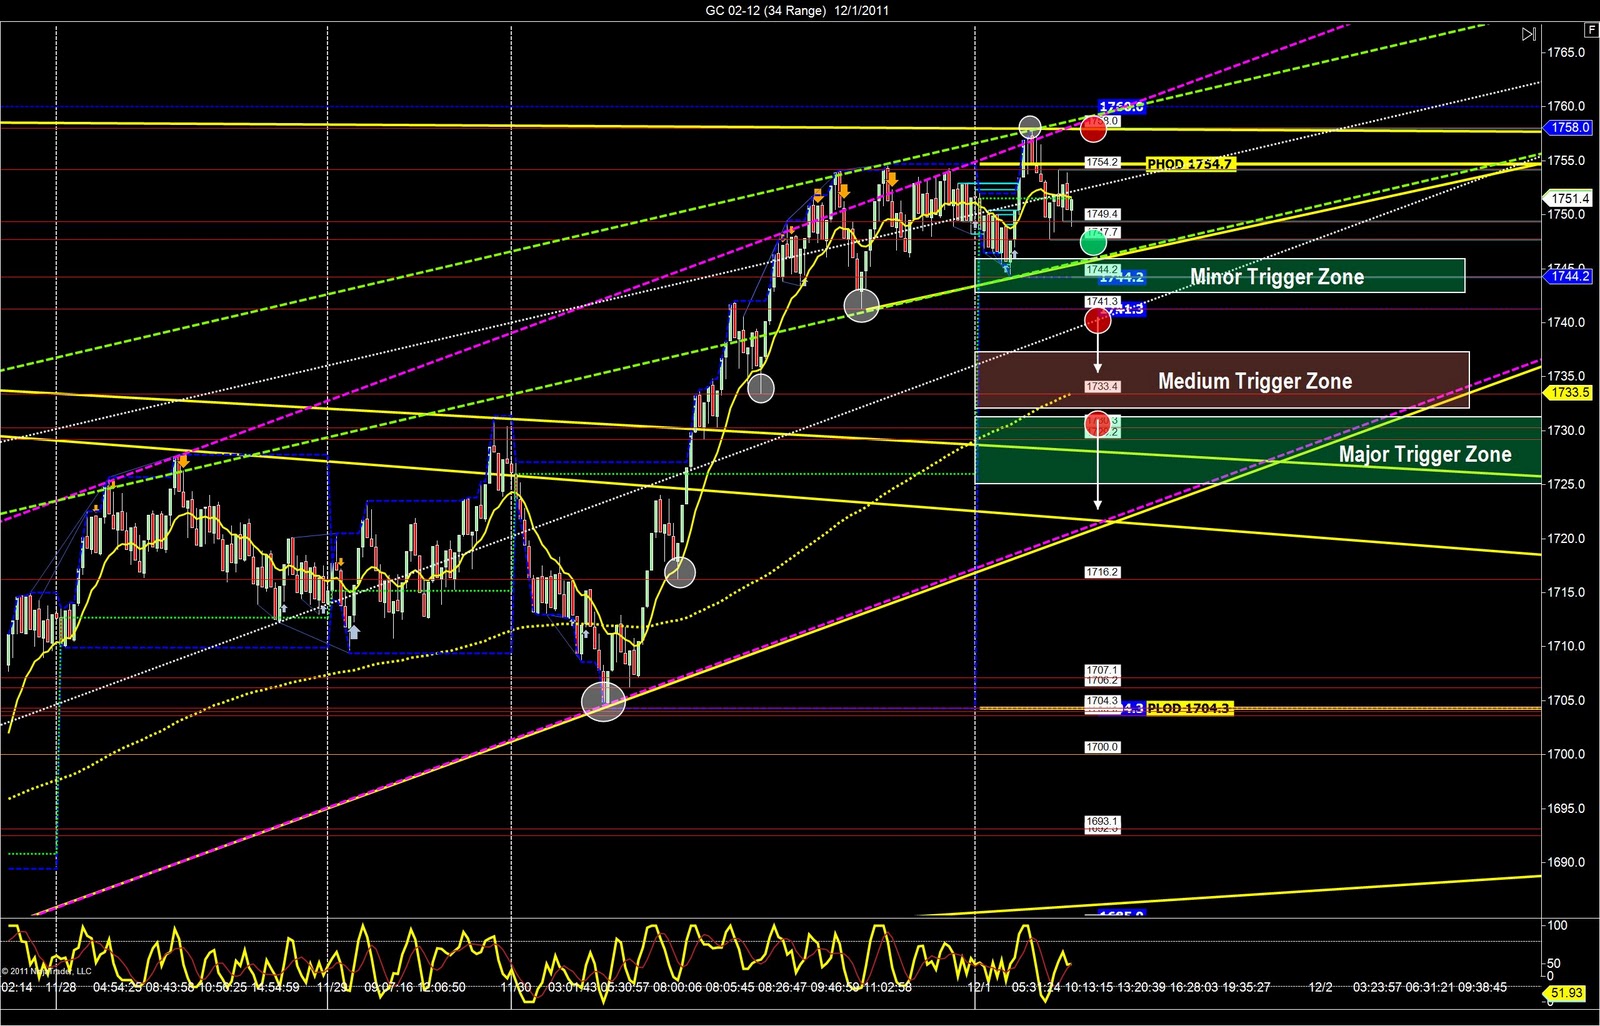
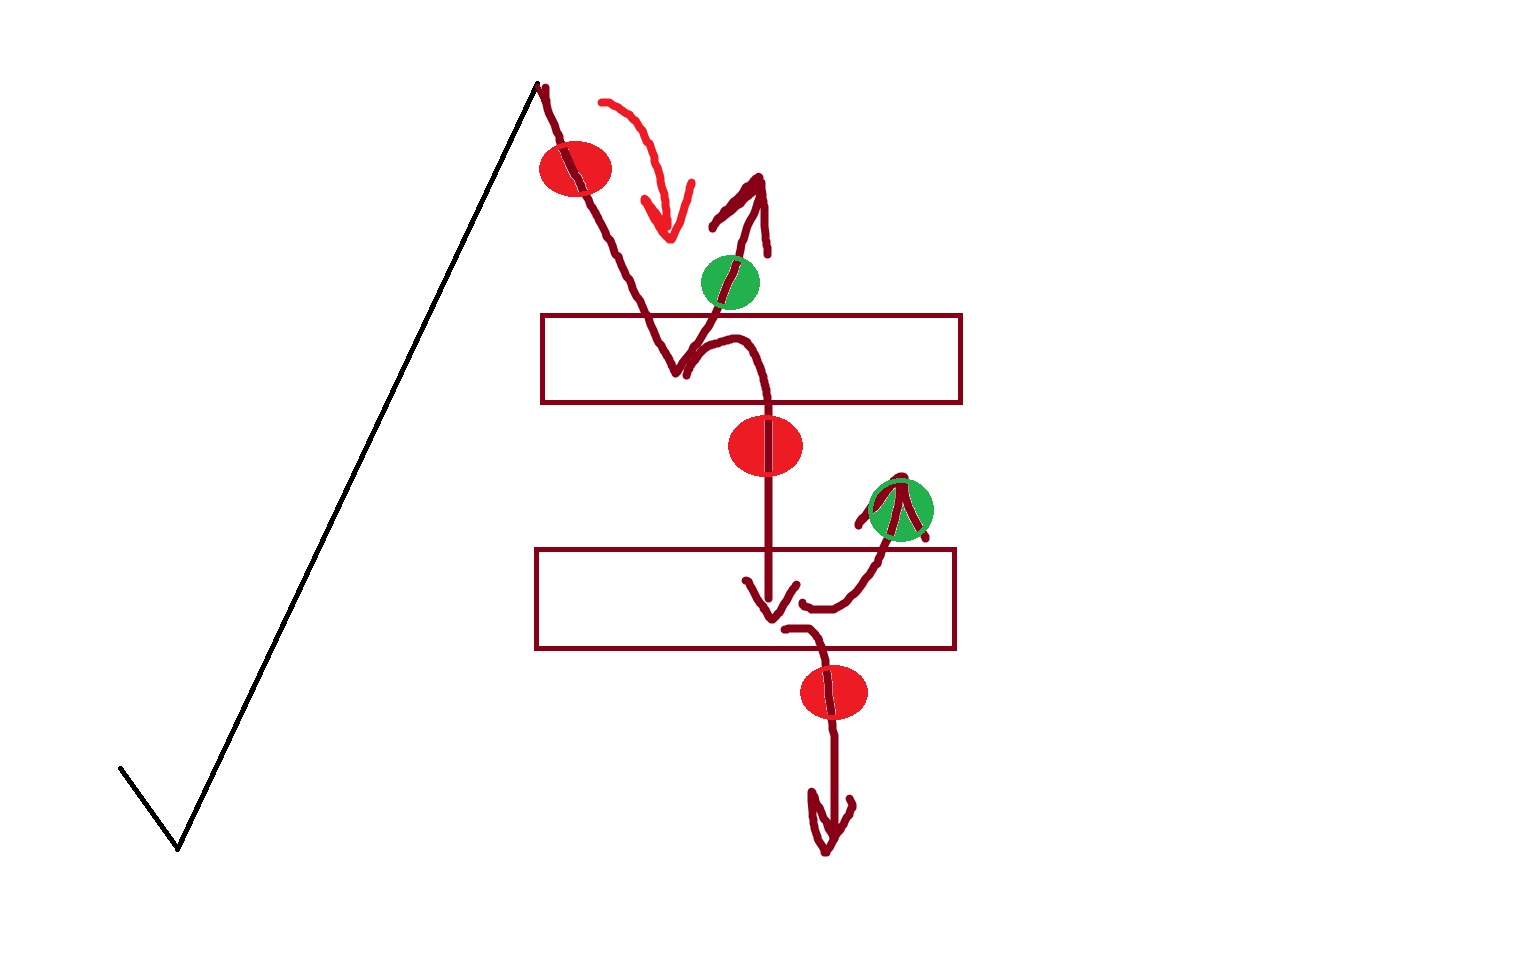
The Gold 21-range chart shows us a lot more specific detail about where we should be trading this morning. You can see the different trigger zones and the short bull price channel. As price rises im selling the highs of the channel, and when price falls I will buy the channel lows. If price breaks below the 1741.3 we then start selling off, into the ‘zones’ below us.
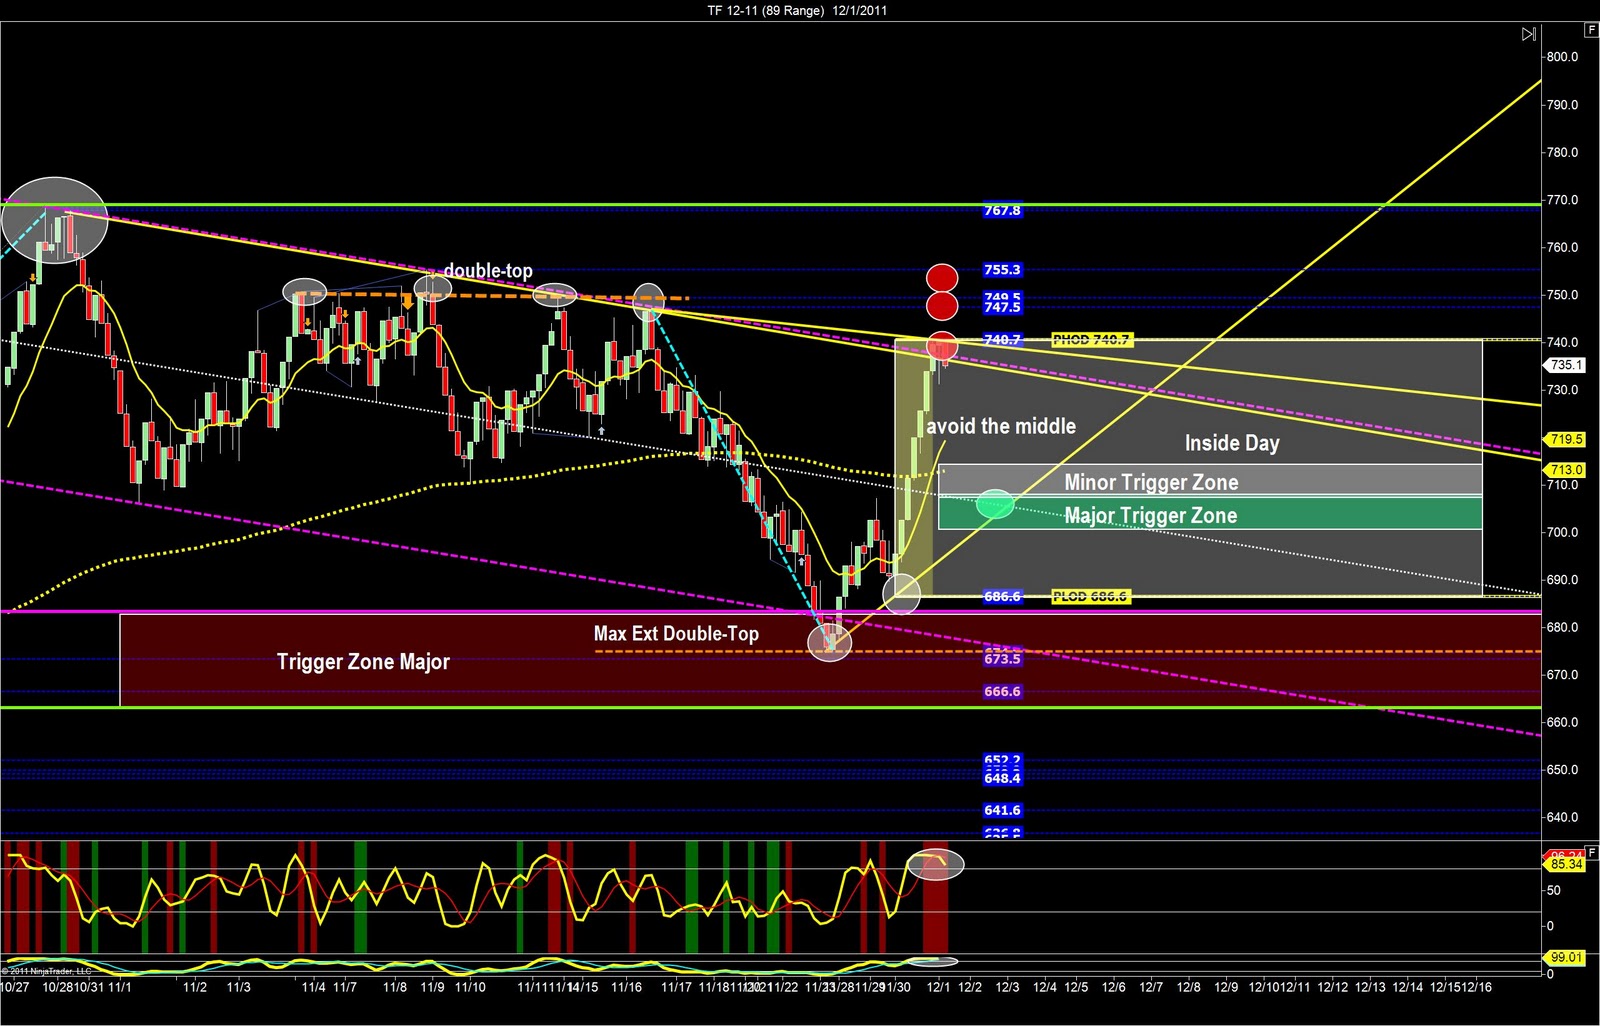
The Russell Futures trading at the channel highs, the PHOD, and the price wedge highs, so looking to sell these highs. Avoid trading in the middle of the range, and look for price to move to the lows of this range and buy in the trigger zone around 705.00-710.00 area.