- in Uncategorized by schooloftrade
Day Trading Morning Prep Gold, Crude Oil, Dollar Index, Euro, E-mini Russell Futures

Looking at the news this morning, we have important news at 900 and 1000am EST. Remember, this is the end of the first quarter, so volume has been lighter than usual, and these news events will be vital ‘sparks’ to get the market moving this morning.
We’ve seen the markets slow down dramatically after the last news of the morning, so look for a slowdown from 1030-1130am EST while the markets wait for the European close.
Lets take a look at the chart’s we’re watching this morning…
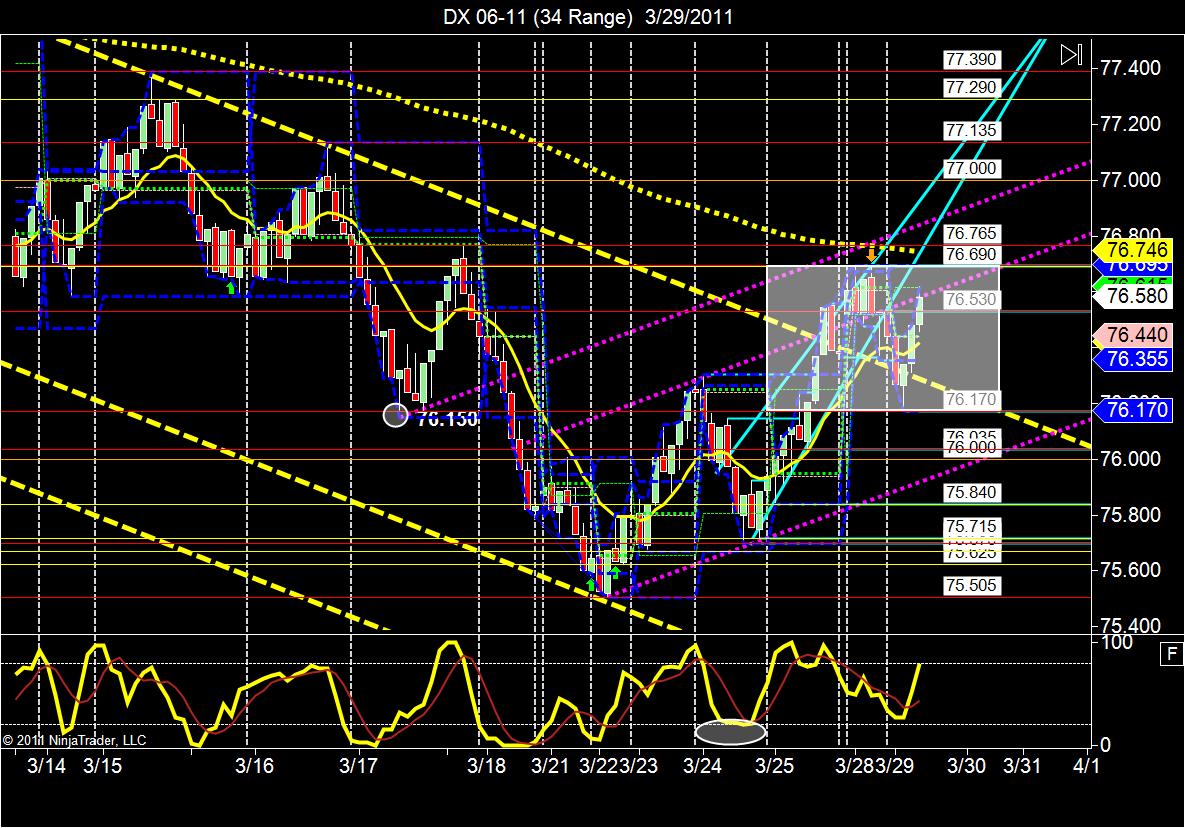
You can see four important aspects to consider this morning:
- Long term bearish price channel
- Short term bullish price channel
- Overhead BMT Line @ 76.747
- Sideways Range from 76.690 – 76.170
The first thing I notice is that we’ve broken the long term bearish price channel. This tells me there will be the BIG money trying to pull this price back DOWN below 76.170 into the downward sloped channel.
We also notice a more short-term BULLISH price channel, which means im looking to buy at pullbacks, so the dollar should RISE, which should continue to push prices DOWN on the markets we trade.
With the prices rising in this channel, we also see MAJOR resistance overhead, the Big Money Trigger Line (BMT) is at 76.746. I expect to see the price on the Dollar Index slow down at this resistance and look for a transition.
If prices break above 76.746 we will look for the major change in trend direction, the buyers will be in control. If the BMT line holds at 76.746 we should see the sellers try and push this back down below 76.170 into the channel below us.
Lastly, we may see a sideways market on the DX 06-11 today. Look for the sideways range from 76.690 down to 76.170.
Buy the lows and sell the highs, and remember to always follow the Dollar Index Futures Correlation when using the dollar to make trading decisions.

Crude Oil Futures
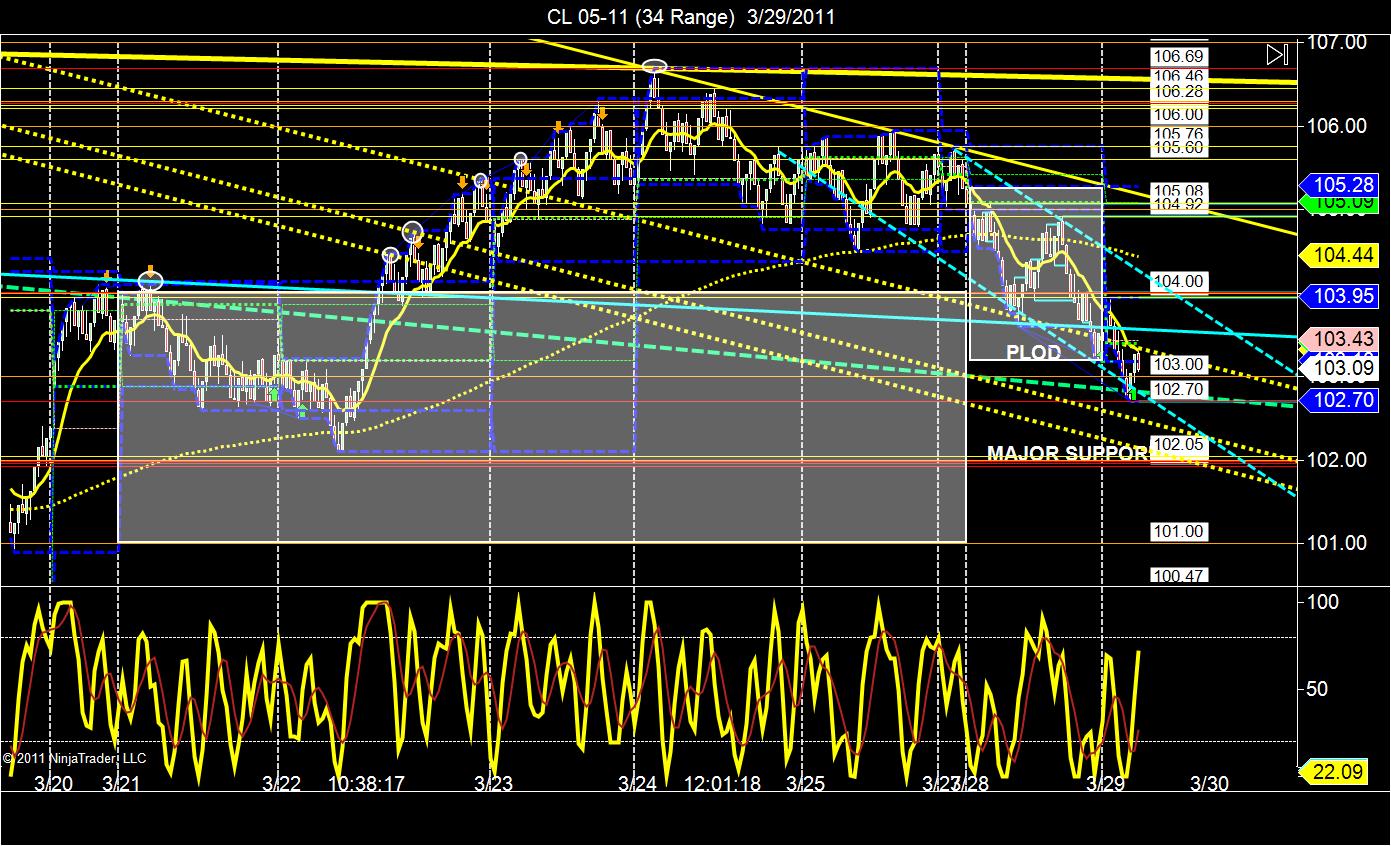
- Bearish Price channel(s)
- PHOD and PLOD
- Major Support @ 102.00
- Sideways Range from 104 down to 101
Bearish price channel tells us to be selling first, trading with the short term trend. Sell retracements as price drops, and look to buy at support for small scalp-sized buying opportunities.
The best trades today will be to sell at resistance as price is rising off support.
The next thing we see is the trading range from Monday. We dropped below this range earlier this morning, but now the price is trading just above the PLOD.
When price < PLOD the buyers are now in charge and we look to test the PHOD. If the PLOD holds and price tumbles again, this confirms for us that the SHORT side will be the winning side today.
102.00 is major support from our 89range chart, so beware trading short into this level. I will look to take profit around 102.00 rather than entering a trade.
The sideways range from 104 down to 101 leads us to believe that we will indeed test the 101.00. The key is that when price enters the top of a range it will always TRY to test the LOWS of the range.
Our main focus will be on where price is trading in relationship to the PLOD. If we’re above the PLOD we will be INSIDE monday’s range, so beware. Inside days = caution

We have contract rollover on gold to the 06-11 contract. Make sure you use the correct front month, and search the blog for contract rollover info on any market.
Four things i see today:
- Bearish Price Channel
- Short term price wedge
- Sideways Range from 1422.9 down to 1410.1
- PHOD and PLOD, inside day
Bearish Price channel means im looking for selling opportunities at resistance levels. Sell the highs if price rises, and sell retracements if price falls to new lows.
Next we see a short term price wedge. We see a higher low this morning at 1411.0 and this creates the lows of the wedge. the highs of the wedge is the top of the bearish channel.
Buy the lows and sell the highs of the wedge, and remember the SELL side will be the better side with the short term trend being down.
We are trading INSIDE the range from monday. PHOD is above, and PLOD is below us. We should expect these be tested, and if they are tested we need to use them for buying and selling opportunities.
Buying the PLOD and selling the PHOD, unless they break, then buy pullbacks at new highs and sell retrcements at new lows.
INSIDE DAY = use caution
We can also see the sideways market formed from 1422.9 down to the PLOD at 1410.1. We want to Buy the lows, sell the highs, and avoid the middle of this sideways range.