- in Uncategorized by schooloftrade
Day Trading Morning Prep Gold, Crude Oil, Dollar Index, Euro, E-mini Russell Futures

8:20 Gold & Currencies OPEN
Crude Oil Futures
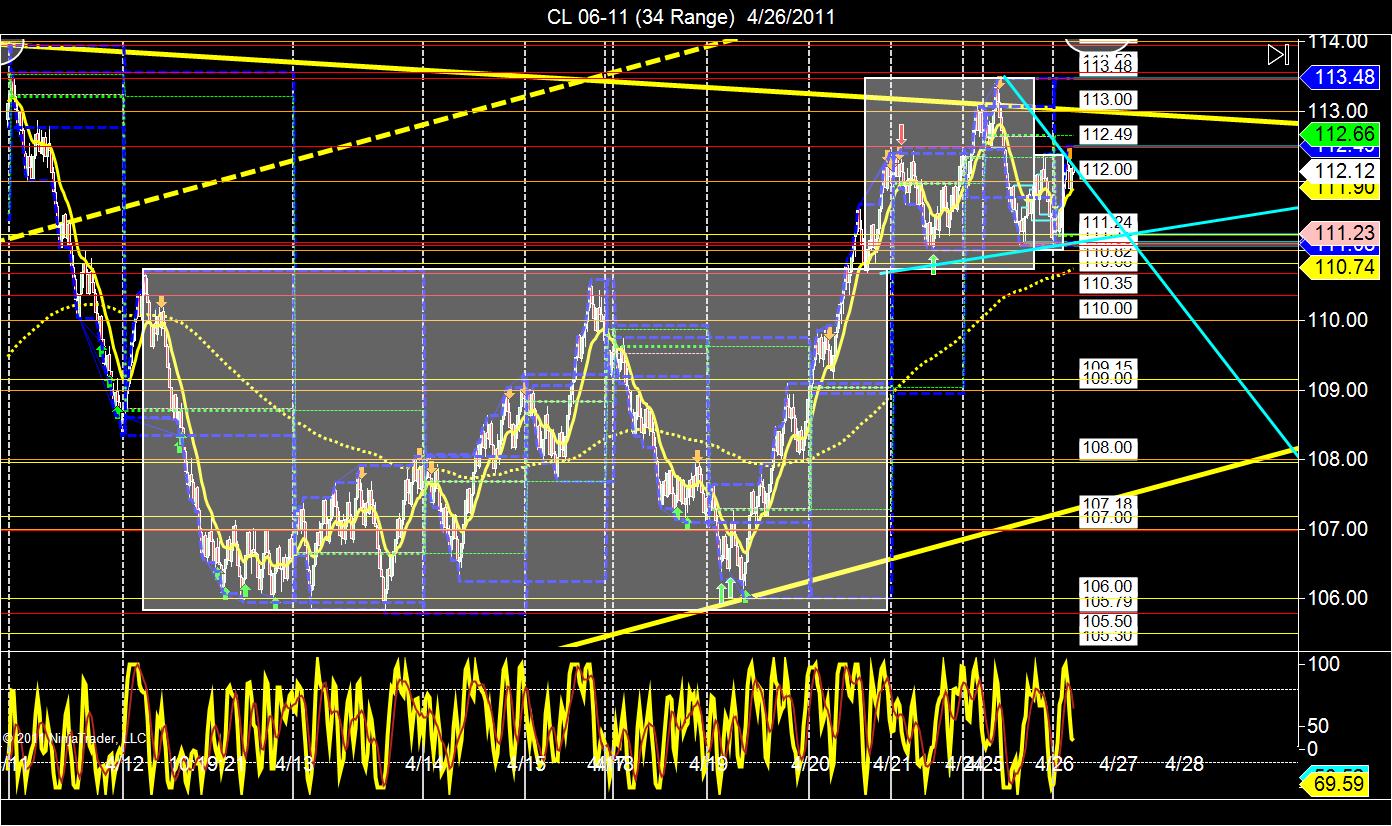 |
| 34Range Crude Oil |
Open your 34range chart and you can see the following:
- Major Price wedge in yellow trend lines
- Minor Price Wedge in Blue trend lines
- Sideways Range in white box
- PHOD and PLOD
- Previous Trading Range below us
- BMT Below us
The first thing I notice is the Major price wedge in yellow trend lines. I got this from my 89range chart, and the trend lines are added automatically using Global Drawing Objects for NinjaTrader7.
You can easily see we are at the highs of this major price wedge. I can also see a minor price wedge in blue trend lines, confirming higher lows and lower highs, which shows clues for narrowing price action.
The sideways range(s) are very important as well. Im going to use the sideways ranges first, so looking to buy the lows and sell the highs of the trading ranges we are currently in first. If we break out of these sideways ranges THEN i can make decisions to buy pullbacks or sell retracements, but first, we trade the range we are in at the moment.
Next, make sure we remember the PHOD is above us, and the PLOD is below us, making this an
- As prices rise im selling first, then buying pullbacks with new highs
- selling resistance at the highs of the wedge
- selling resistance at the highs of the sideways range(s)
- as prices drop im buying support levels first, then selling retracements with new lows
- im buying the lows of the wedge
- im buying the lows of the sideways range we are trading in
- im selling the highs of the range below us if we can break below .75 and the BMT
- i will not buy the highs and will not sell the lows