- in Uncategorized by schooloftrade
Day Trading Morning Prep Gold, Crude Oil, Dollar Index, Euro, E-mini Russell Futures

Looking at the news today there is not much to worry about, we have an important number on home sales @ 10am EST, but the traders have their ears on the unrest in Libya this morning and specifically how it will affect the prices of crude oil.
As always, we will look at these news events live in our trade room this morning and trade the markets after reading the reaction to this news.
Lets take a look at the charts this morning for the futures markets we trade most…
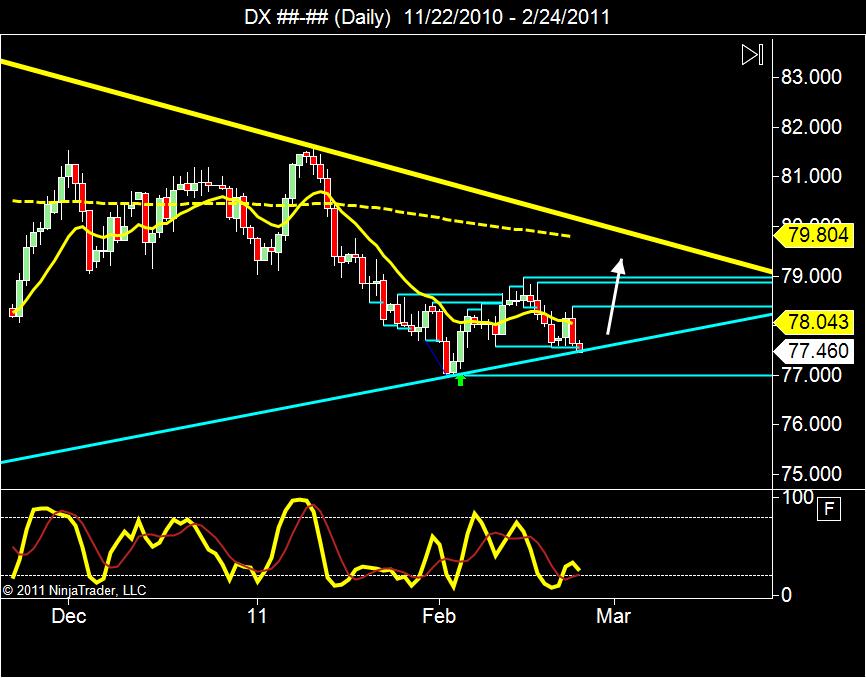
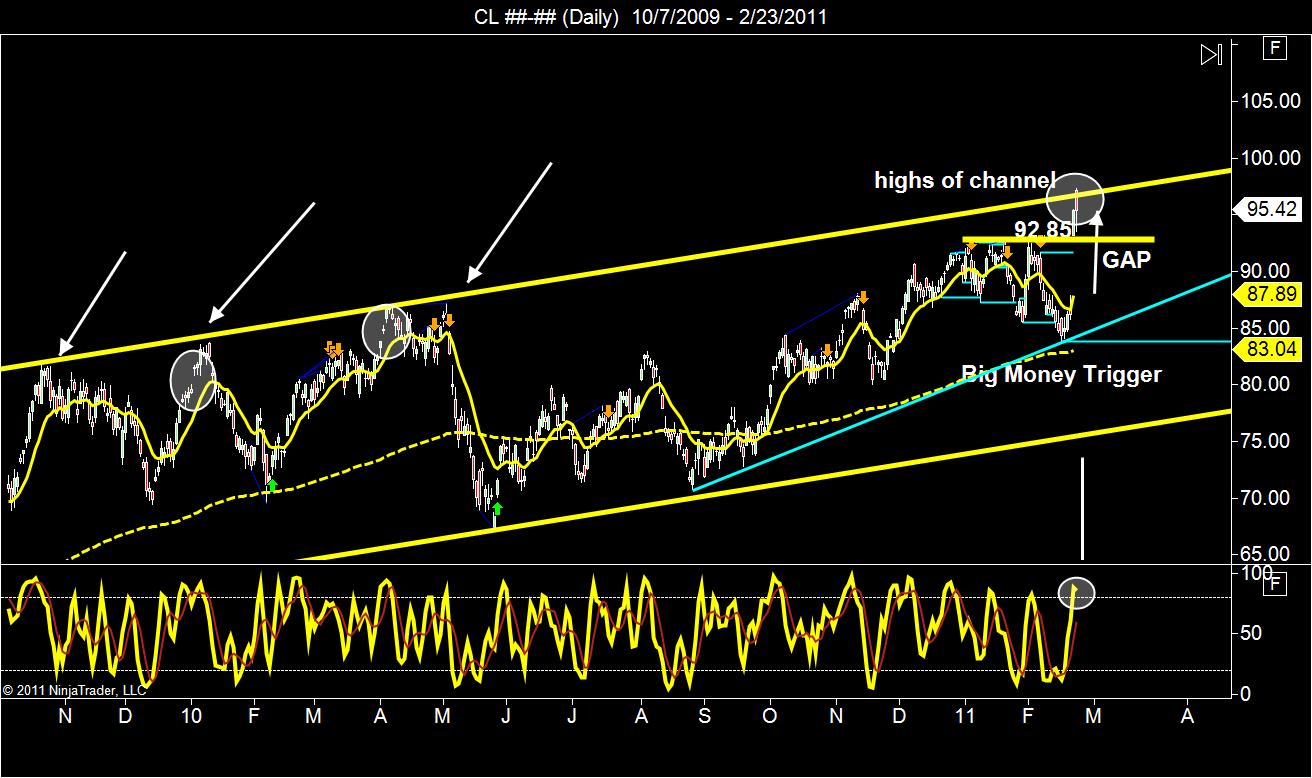
We notice on the daily chart that we have three things to consider:
– Gap UP into the highs
– at the highs of the channel
– overbought momentum
all these signs point to difficulty buying the highs and more likely to see the market drop from these highs.
unfortunately, the daily chart wont tell me where and when to get into the market, it shows me the big picture.
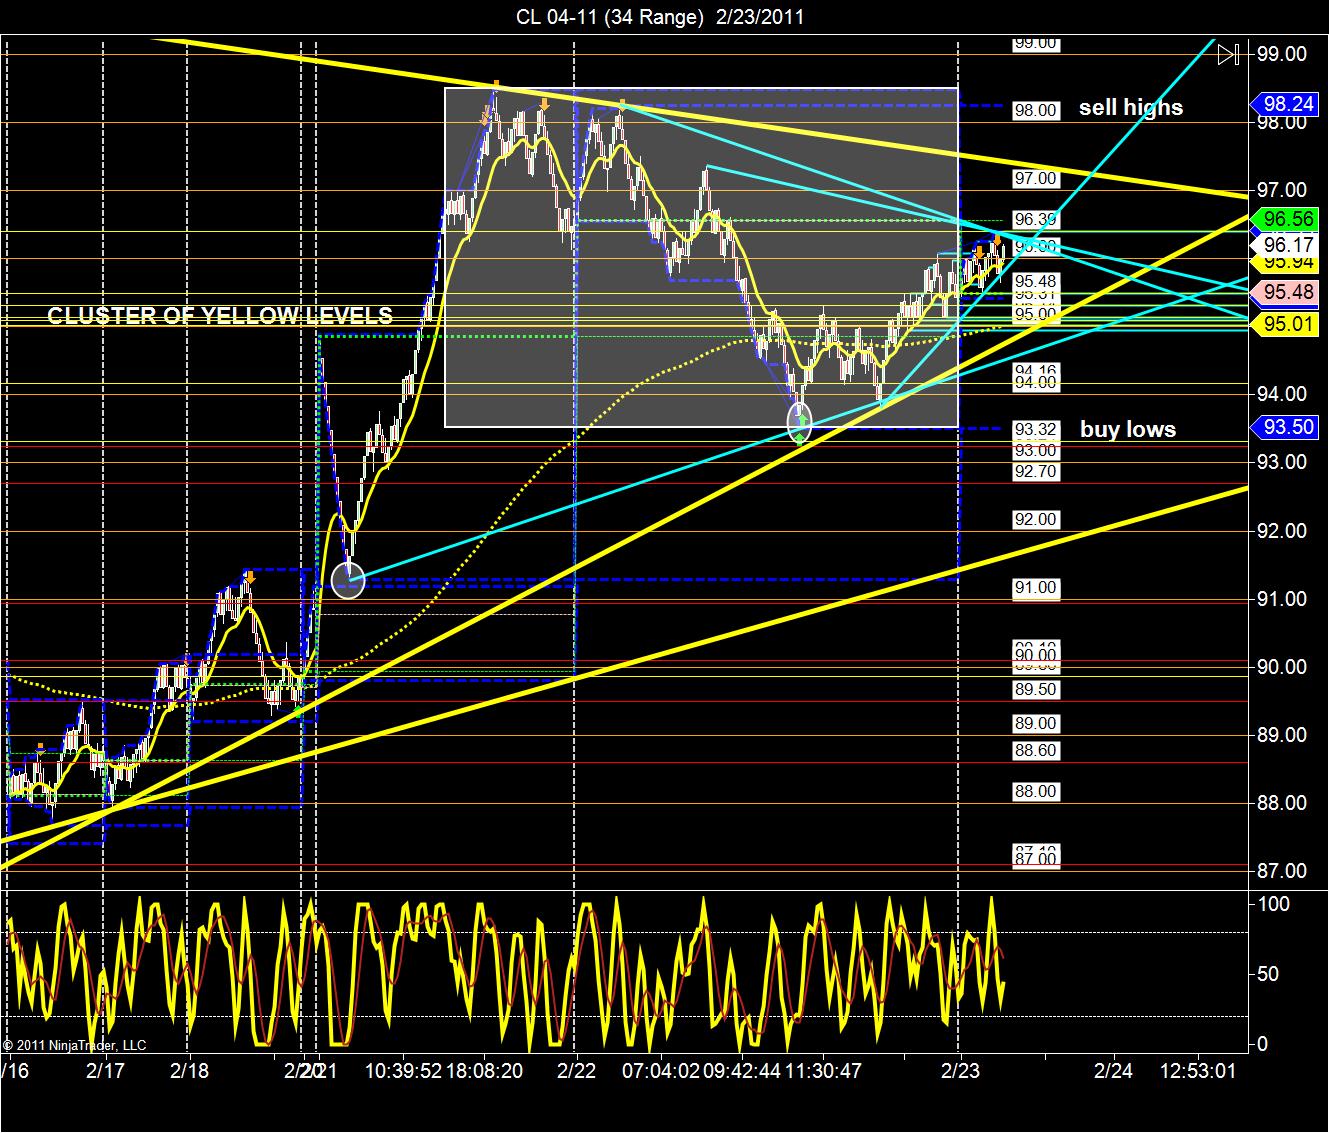
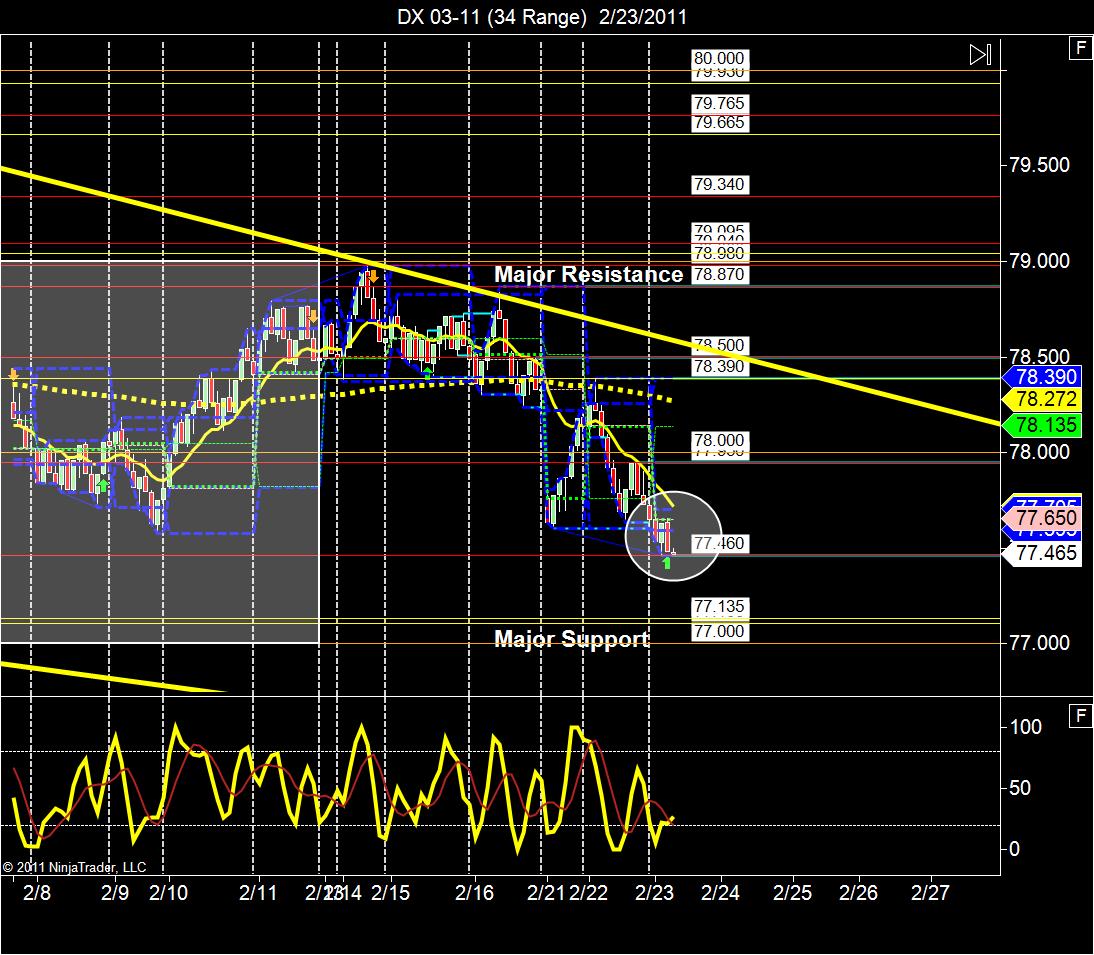
now we’re looking a little fiaster at the 34 range chart and we see a few things to consider:
– middle of the price wedge
– cluster of yellow support levels from our auto levels indicator (double-bottoms)
– Sideways range from 93.32 up to 98.00
always careful around the middle of the wedge, middle of the sideways range, and we see the yellow lines are double top and double bottoms
 we see three things to consider on the DAILY Chart of gold futures:
– momentum is overbought and pointing down
we want to sell the highs of this price wedge, then look at the lows of the price channel as support for taking profit, or then entering a buy order (buy the Lows) at lows of the channel.
if we break out to new highs im looking to buy a pullback above 1408.3 and taking profit at 24.4, 32.5 and the highs of the price channel from there.
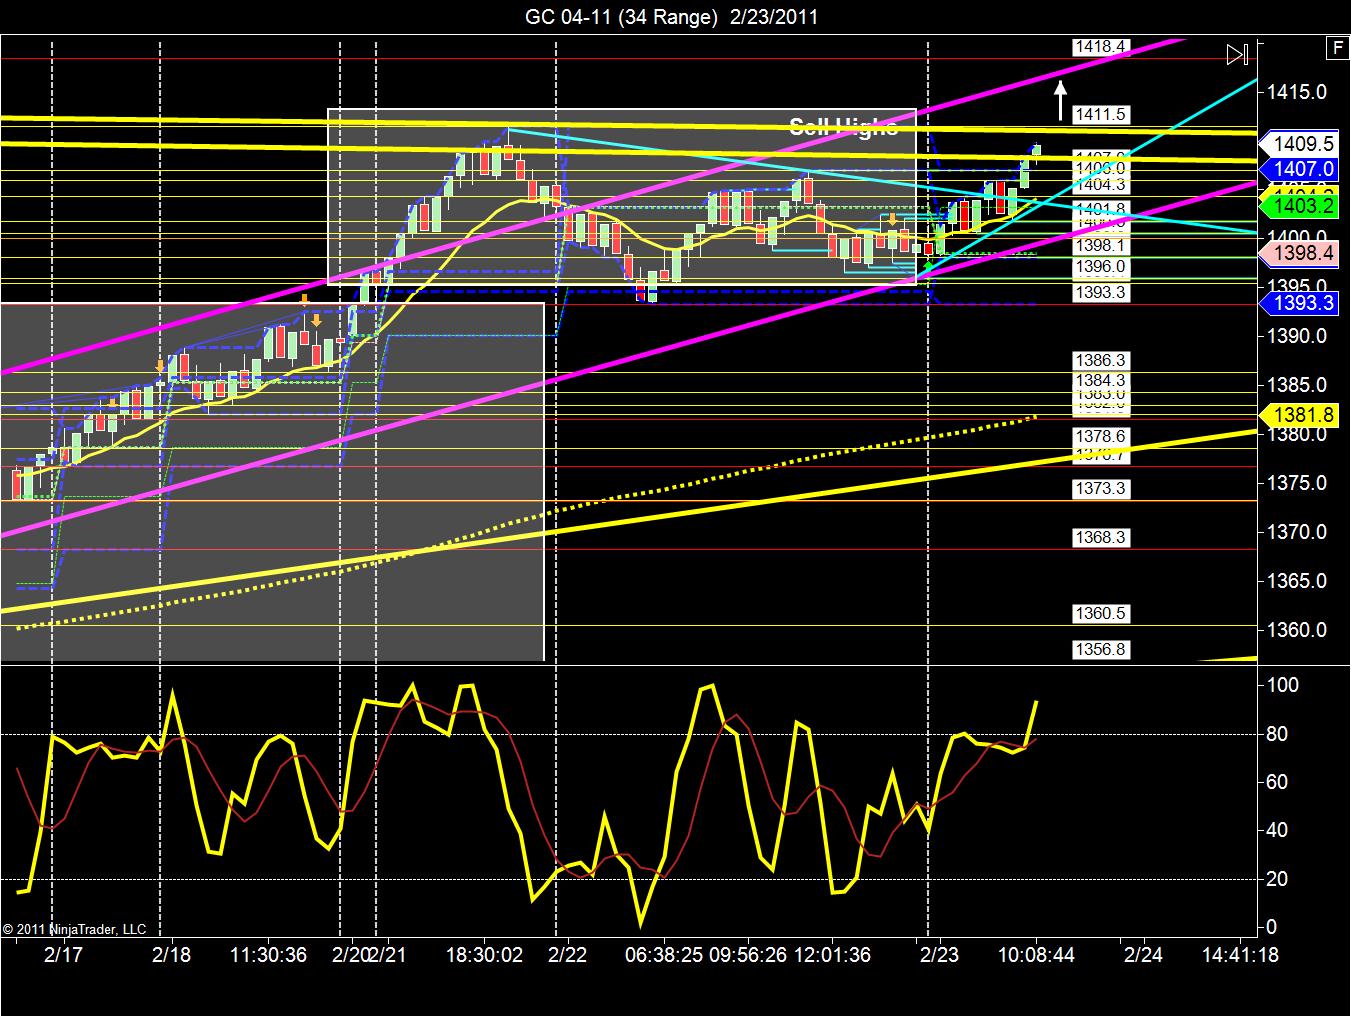
We open up the 34range chart of the 04-11 gold futures contract and we see
– major support at 1393.3
– price channel in pink trend lines
– wedge pattern in yellow trend lines
– sideways range from 1411.5 down to 1393.3
first we want to sell the highs of the gold range, so look first to sell at resistance. If we break the new highs above 1411.5 ill look to buy a pullback, DO NOT let your emotions get the best of you trading into the highs.
we also need to use the price channel to buy the lows and sell the highs, and possibly used to take profit at the correct times.
if we be pullback at new highs, take profit at the highs of the price channel around 1418.0
right now as the gold moves through the overhead resistance trend lines we have a hard time buying into this resistance, so lets be patient and sell the resistance first.