December 10, 2010
- in Uncategorized by schooloftrade
Day Trading Gold, Euro, Crude Oil, Russell Futures

Trade room is OPEN, Click here to join the room
Lets begin our day with the economic news, we have some important announcements to keep an eye on this morning.
830 Trade Balance / Import Prices
955 Consumer Confidence
1100 Beginner’s Training
Now lets check the US Dollar Index Futures market to see where our direction is headed today.
| click me |

We can see the dollar index is trading sideways at the highs of the bearish price channel (yellow trend lines)
We notice a few things about this 21-range chart:
– Long term sideways range from 80.425 down to 79.000
– Most recent range from 80.425 down to 79.700
– We are trading INSIDE DAYS for two days now
– We are not at the highs or the lows of this recent range
– We are in the MIDDLE of this range
– Slow Speed of the tape
– Rock-bottom Average True Range
This information on the dollar chart tells us a lot of what’s going on in this market, and this wil affect the markets we trade dramatically, so we pay close attention to the dollar.
Trading in the middle is my biggest concern. Sideways and choppy dollar will often mean the same for gold, crude,euro, Russell and more.
The best thing we can do right now is realize the dollar is telling us to be careful, and be looking for price to break out of this ‘inside trading day’ and test the highs or the lows 80.425 or 79.700
If the dollar stays flat we need to be extra careful today, being a Friday before the holiday season, this market may go nowhere, but we wont know till we see the news at 830am
Now that we know the dollar index, lets check the Gold Futures market to see where we are today

Gold has been trading sideways at the lows of this price channel for a few days now.
We can see the blue trend lines define this price channel, and after the new highs from late last week, we’ve dropped off those highs on dollar strength and now it looks like gold is looking for some clarity on its next move.
One things we notice right away is the SIDEWAYS trading range we have on this 34-range chart.
Trading sideways markets are easy, just buy the lows and sell the highs, so lets look at the most likely support and resistance levels.
Im going to sell the highs of the recent trading range of 1393.0 and buy the lows of 1382
Inside of this trading range I need to avoid trading in the middle, and wait to buy support and sell at resistance.
One thing I will also be looking for is a breakout, and I have a plan of attack for that too. Since we can see sluggish price action at the highs and lows, im not going to buy the breakout or sell the breakout, im going to use a more efficient way of getting into rising or falling price, selling a retracement or buy the pullback.
Trading sideways markets aren’t difficult, so sell the highs, buy the lows and remember to buy the pullback if we break new highs and sell a retracement if we break new lows.
Lets check out the crude oil futures market
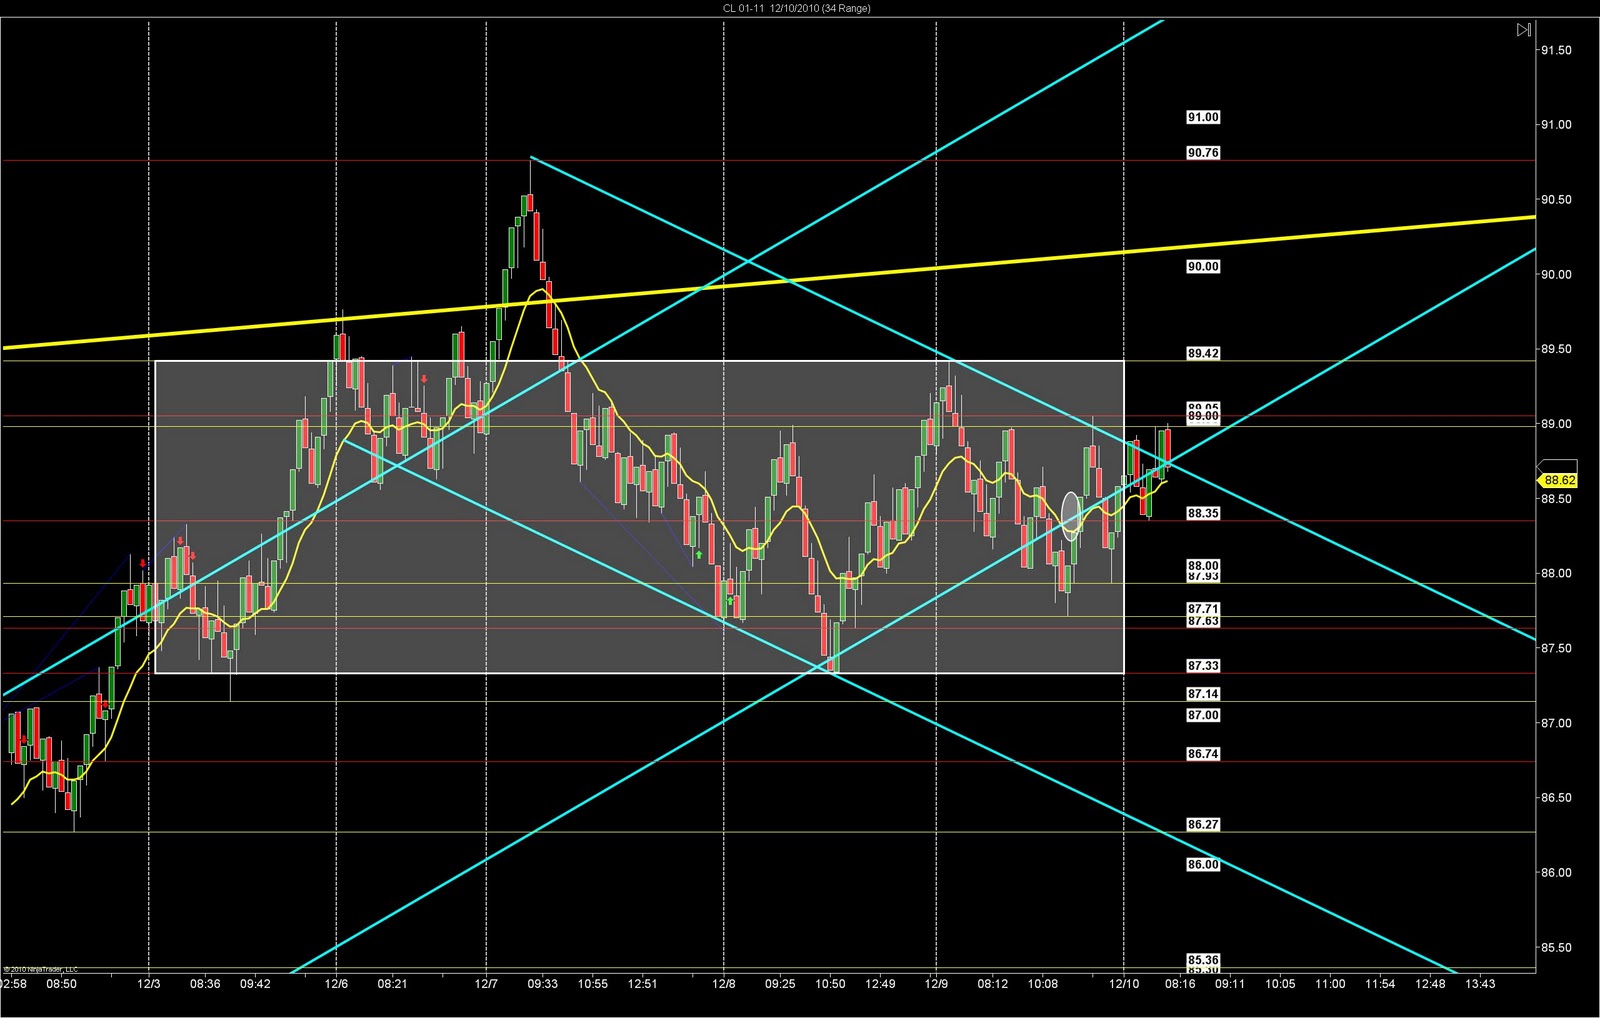
Much like gold, the crude oil market is trading sideways into this morning’s 830am news as well.
We have the price channel (blue trend Lines) and you can see we are the highs of the price channel and in the upper third of the sideways trading range.
As we said with gold, trading sideways markets are easy, buy the lows and sell the highs. Im also going to keep the sideways trading range in mind as well.
Sell the highs of the range below 88.35 support
By support at 88.00 on the way down, or cover your short trade at 88.00 on the way to the bottom of this price channel.
if we break new highs im looking for 89.00 up to 89.42, and I will take profit at the highs and sell the highs of 89.42 taking it back down.
Sell the highs and buy the lows, this is how we will be trading this crude oil market today.
Lets check the euro futures market

We’re trading sideways at the highs of the price channel, so im looking to sell these highs, taking profit at levels of support on the way to the bottom of the price channel.
We see a sideways market, so remember we can buy support and sell resistance.
So look to for a short term day trade buy at 1.3163, and a long term sell at 1.3284
We look for short term bounces, and long term drops because we’re at the highs of the price channel, and since we’re trading sideways there is not short term trading bias.
I can also keep an eye on new highs, and look to buy the breakout.
One thing to concern is that buying the highs or selling the lows in a sideways market can be very tricky.
Fake-out breakouts are always happening on sideways markets, so don’t try and predict, react to the breakout with buying a pullback and selling a retracement.