May 2, 2013
- in Uncategorized by schooloftrade
Crude Oil Prices CANNOT go lower…RIGHT? Daily Price Levels for 05/02/13

 |
| Crude Oil Daily |
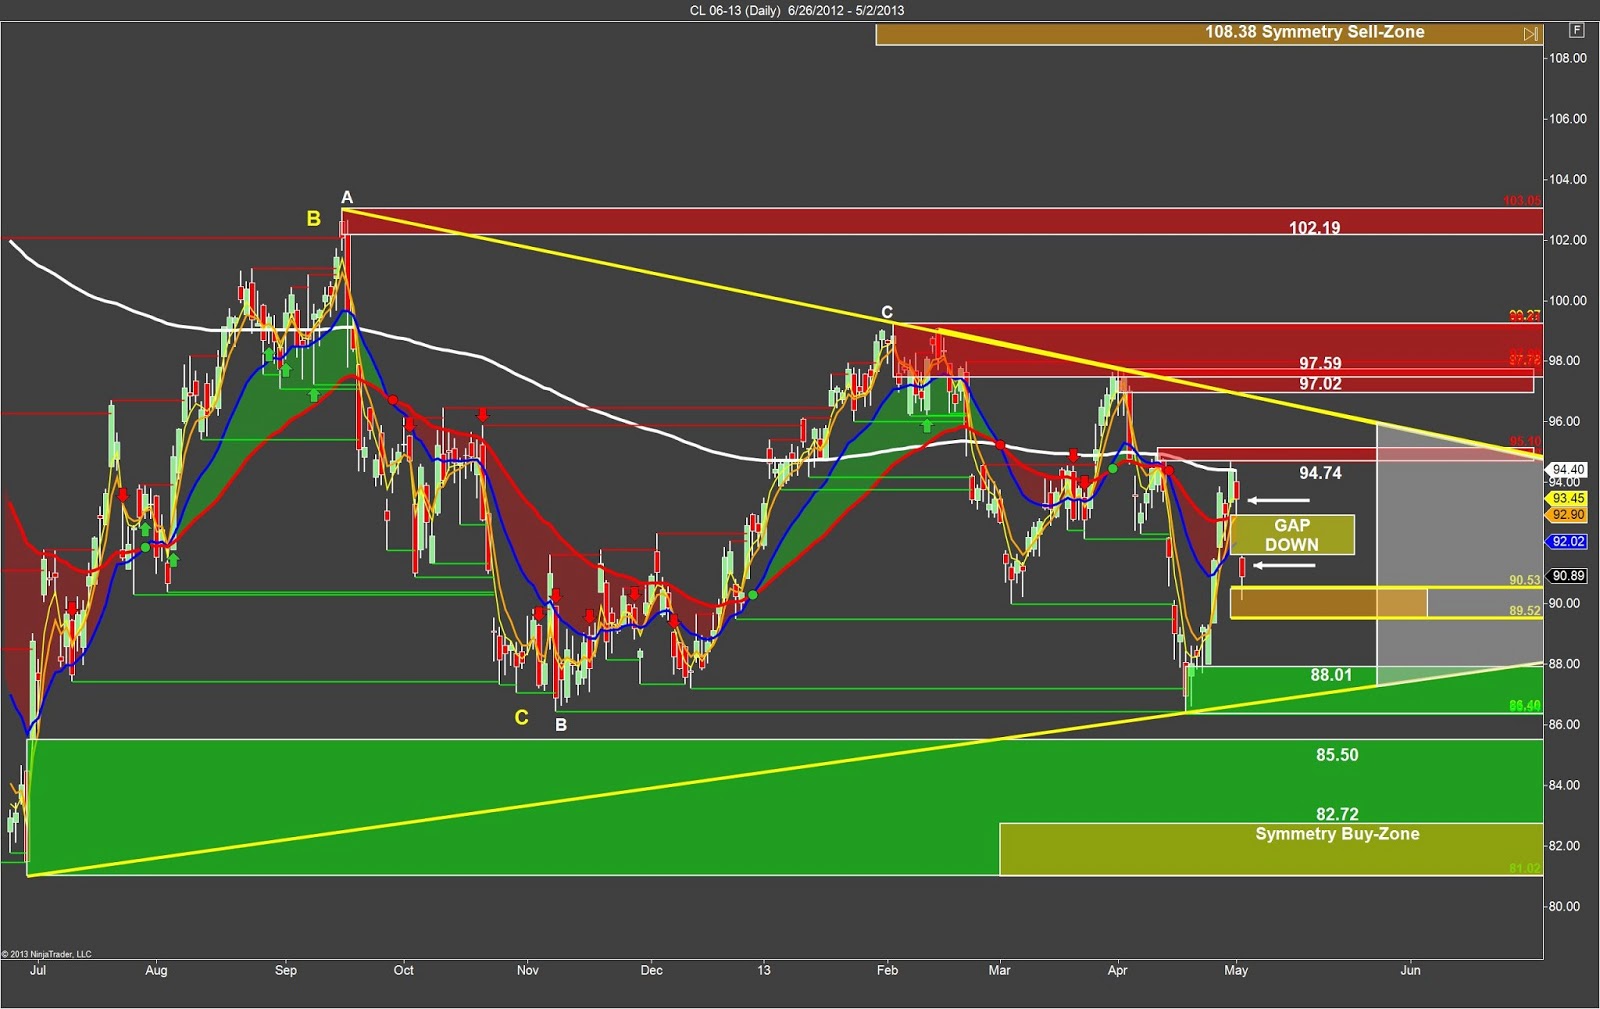
Crude Oil Daily:
Our daily anchor chart shows this massive gap-down this
evening, which easily tells us these sellers are now in full control. We never even TRIED to fill that gap at the
opening bell this morning, and traders took this price-action all the way back
to the big-round-number of 90.00 when less than 3 days ago we were thinking
100.00 may be in the cards….not so fast!
We can see the Fibonacci-based trigger-zone support levels at 90.53 and
89.52 which will provide support as price falls lower. What will tomorrow bring? A close below 89.52 means we’re headed to
88.01 but if we can get another close on Thursday above the 90.53 the buyers
will leave the door wide open for this to be nothing more than a pullback on
the way higher to 94.74.
 |
| Crude Oil 4-Hour |
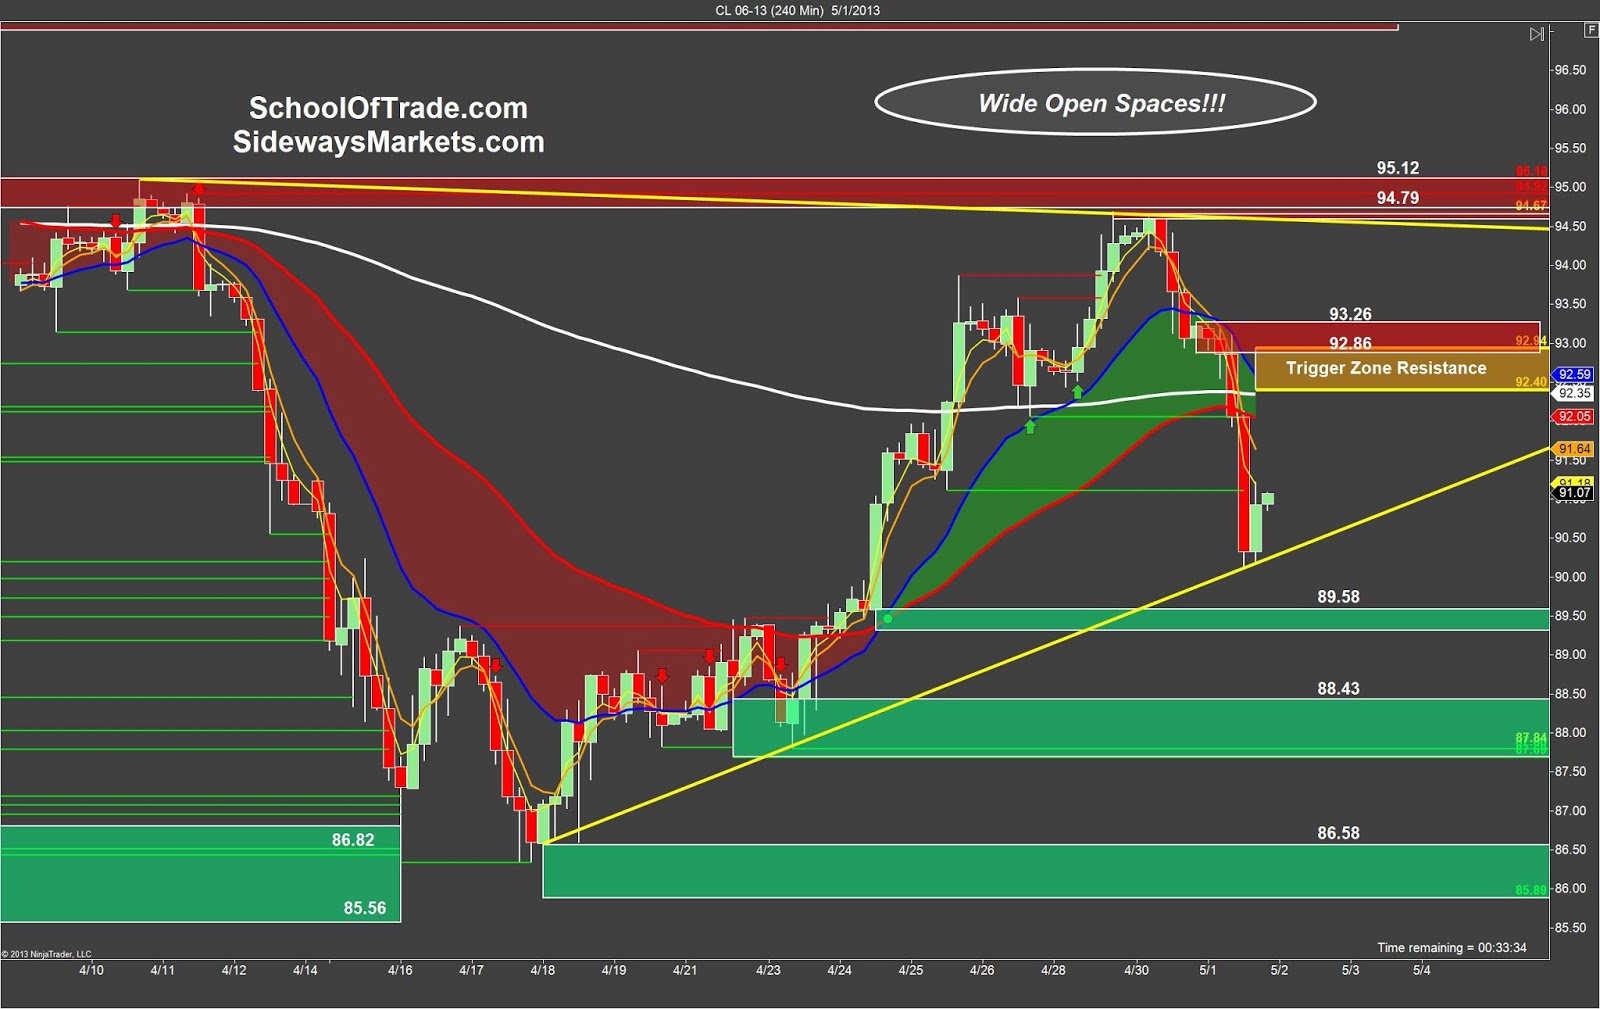
Crude Oil 4-Hour:
The 240-Minute anchor chart shows just how strong that
sell-off was this morning on Crude Oil Futures.
We have defined our trigger-zone above us at 92.40 – 92.94 which becomes
a major turning point for the buyers and sellers. A close back above the 92.94 will signal
buyers have taken back control, while a failure to close above the 92.40 on
Thursday will mean there is more to come to the downside. Look for a test of the 89.58 buy-zone,
followed by a price-reversal to get long.
If prices collapse and move below 89.58 buy-zone we will see a test of the
88.43 and we will be looking to sell retracements on the way down.