November 20, 2012
- in Uncategorized by schooloftrade
Crude Oil Futures Chart Prep:

 |
| CRUDE OIL CHART PREP |
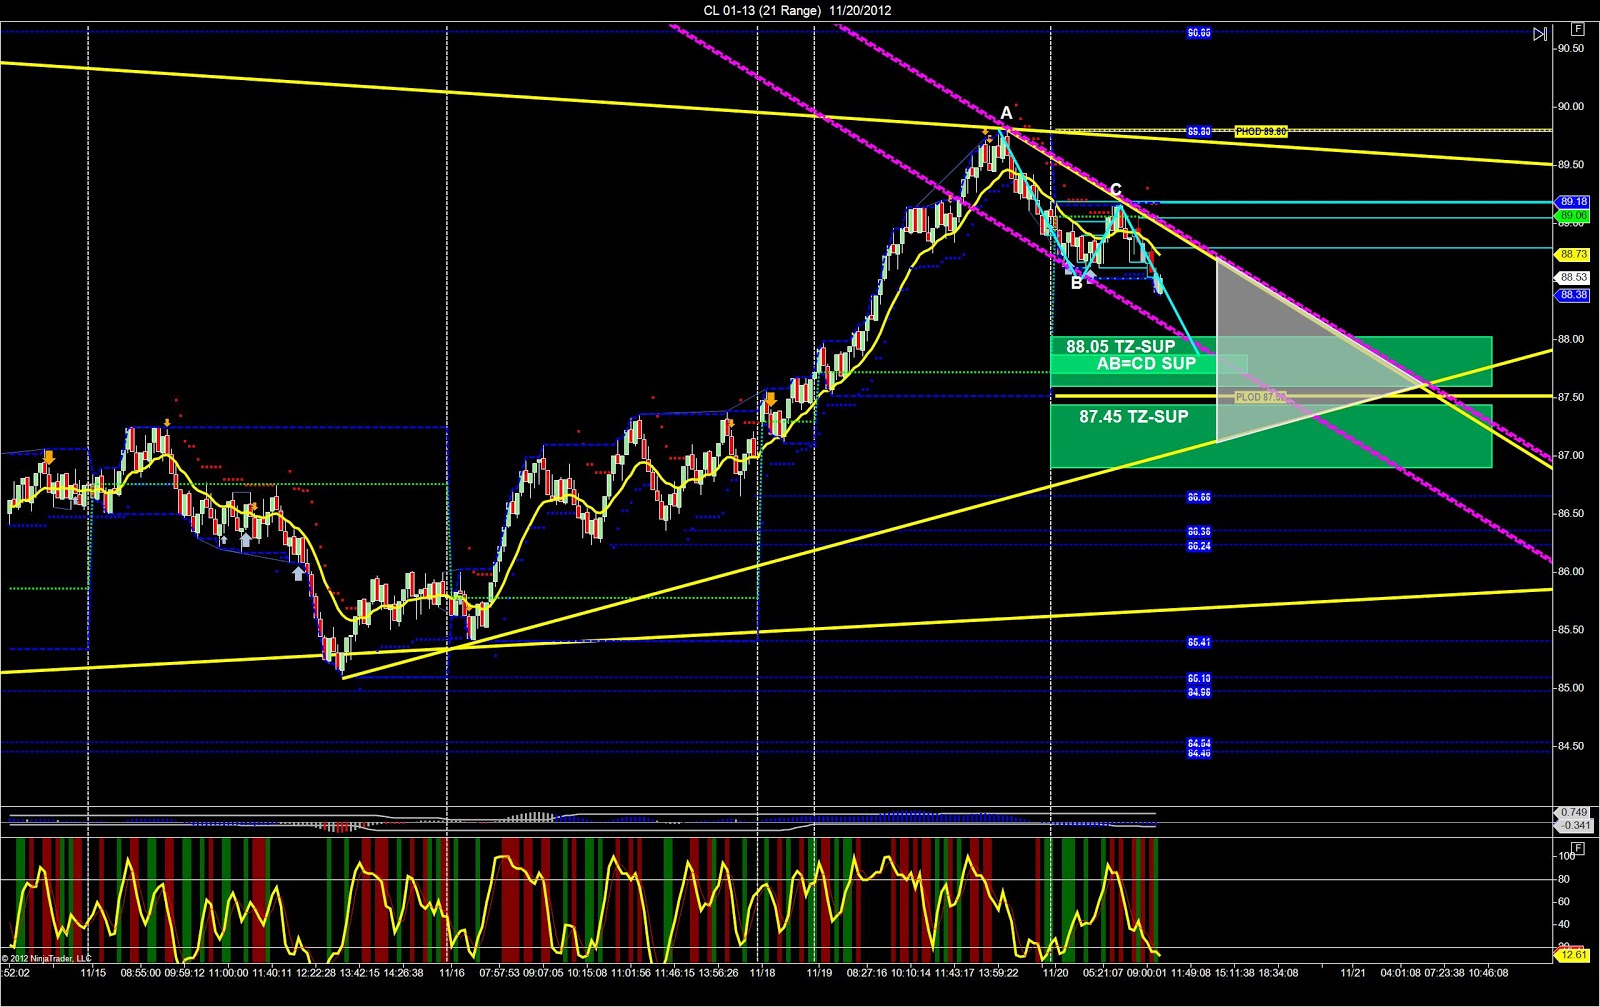
We can zoom
out on the 89-range chart and see the major trend lines for resistance and support
which create a very wide price-wedge.
out on the 89-range chart and see the major trend lines for resistance and support
which create a very wide price-wedge.
We can also
see the recent bearish price-channel which has been broken by new higher-highs. In addition to the price-channel resistance we
can see the trigger-zone resistance at 89.60 and above that at 93.00.
see the recent bearish price-channel which has been broken by new higher-highs. In addition to the price-channel resistance we
can see the trigger-zone resistance at 89.60 and above that at 93.00.
We have new higher-highs
and INSIDE the trading range from Monday screams at us we have a range-bound
market. A range-bound market tells me to
sell-the-high at resistance and buy-the-lows at support and we have recently
come off the highs and we are looking to re-test the lows.
and INSIDE the trading range from Monday screams at us we have a range-bound
market. A range-bound market tells me to
sell-the-high at resistance and buy-the-lows at support and we have recently
come off the highs and we are looking to re-test the lows.
We can draw
a new trend line off the recent swing-high and create a new, wider price-wedge. We can also locate a double-top which
provides us with support starting at 83.80 and moving lower to 82.00 and 79.65.
a new trend line off the recent swing-high and create a new, wider price-wedge. We can also locate a double-top which
provides us with support starting at 83.80 and moving lower to 82.00 and 79.65.
 |
| CRUDE OIL CHART PREP |
Our day
trading strategy for Crude Oil is to fade-the-breakouts and sell the highs of
this range. We called the short trade on
Monday and we can see the sellers have taken control of this market personality
very quickly this morning.
trading strategy for Crude Oil is to fade-the-breakouts and sell the highs of
this range. We called the short trade on
Monday and we can see the sellers have taken control of this market personality
very quickly this morning.
We are
trading as an inside-day which means when we failed at the PHOD we now know the
PLOD is our final profit-target for the short sellers. As price falls lower im selling retracements using
a wave-pattern-short and taking profit-targets at major support below us, with
a final profit-target at the PLOD.
trading as an inside-day which means when we failed at the PHOD we now know the
PLOD is our final profit-target for the short sellers. As price falls lower im selling retracements using
a wave-pattern-short and taking profit-targets at major support below us, with
a final profit-target at the PLOD.
If price tries
to re-test the highs we need to be very patient because trying to buy as the
price rises to the highs will be higher risk and very inconsistent. The high-percentage-trades occur when we sell
at the highs, rather than trying to buy into the highs. If we test the 89.80 area we look for selling
opportunities.
If price
trades sideways we need to sit-on-hands because we are in the middle of the sideways-trading-range.
trades sideways we need to sit-on-hands because we are in the middle of the sideways-trading-range.