May 28, 2013
- in Uncategorized by schooloftrade
Crude Oil day trading strategy says to buy pullbacks

 |
| Crude Oil Weekly |
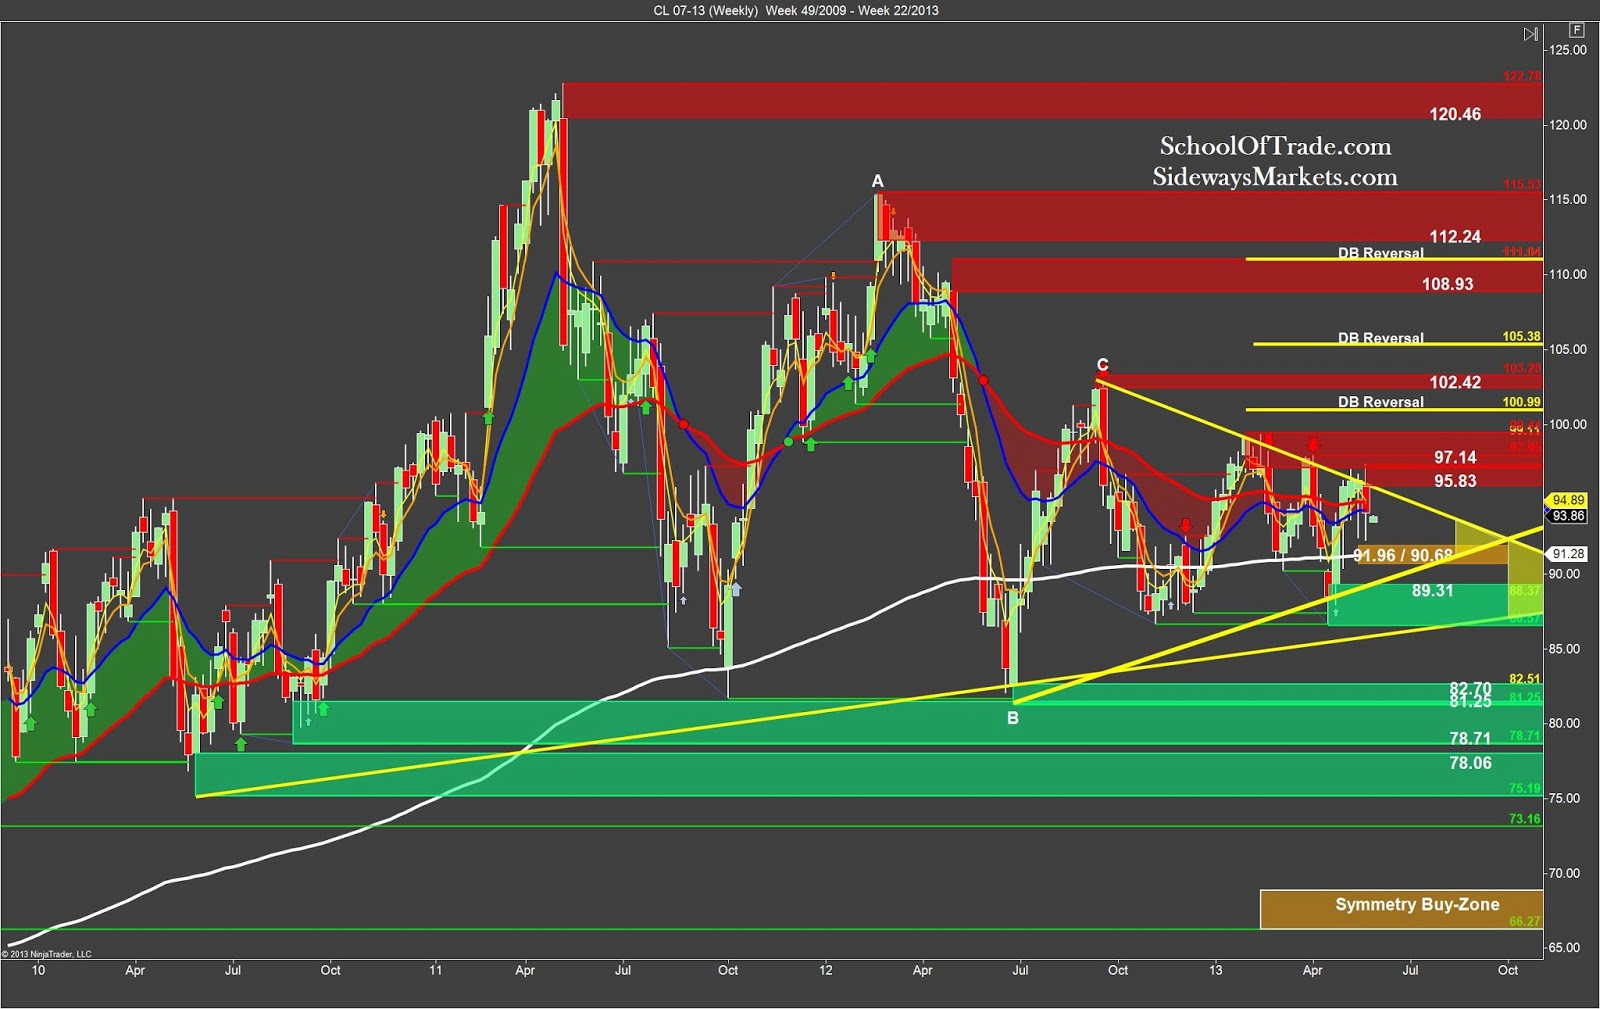
Crude Oil Weekly:
Weekly
anchor chart shows us an open to a new holiday-shortened week in the middle of
this price-wedge structure we have been trading within for the last 3
weeks.
Click here to view ALL of the Daily
price-levels
anchor chart shows us an open to a new holiday-shortened week in the middle of
this price-wedge structure we have been trading within for the last 3
weeks.
Click here to view ALL of the Daily
price-levels
The last 4 weeks of
trading have been spent testing the highs of the price-wedge and only last week
did we finally feel like the sellers had taken back control.
 |
| Crude Oil Hourly |
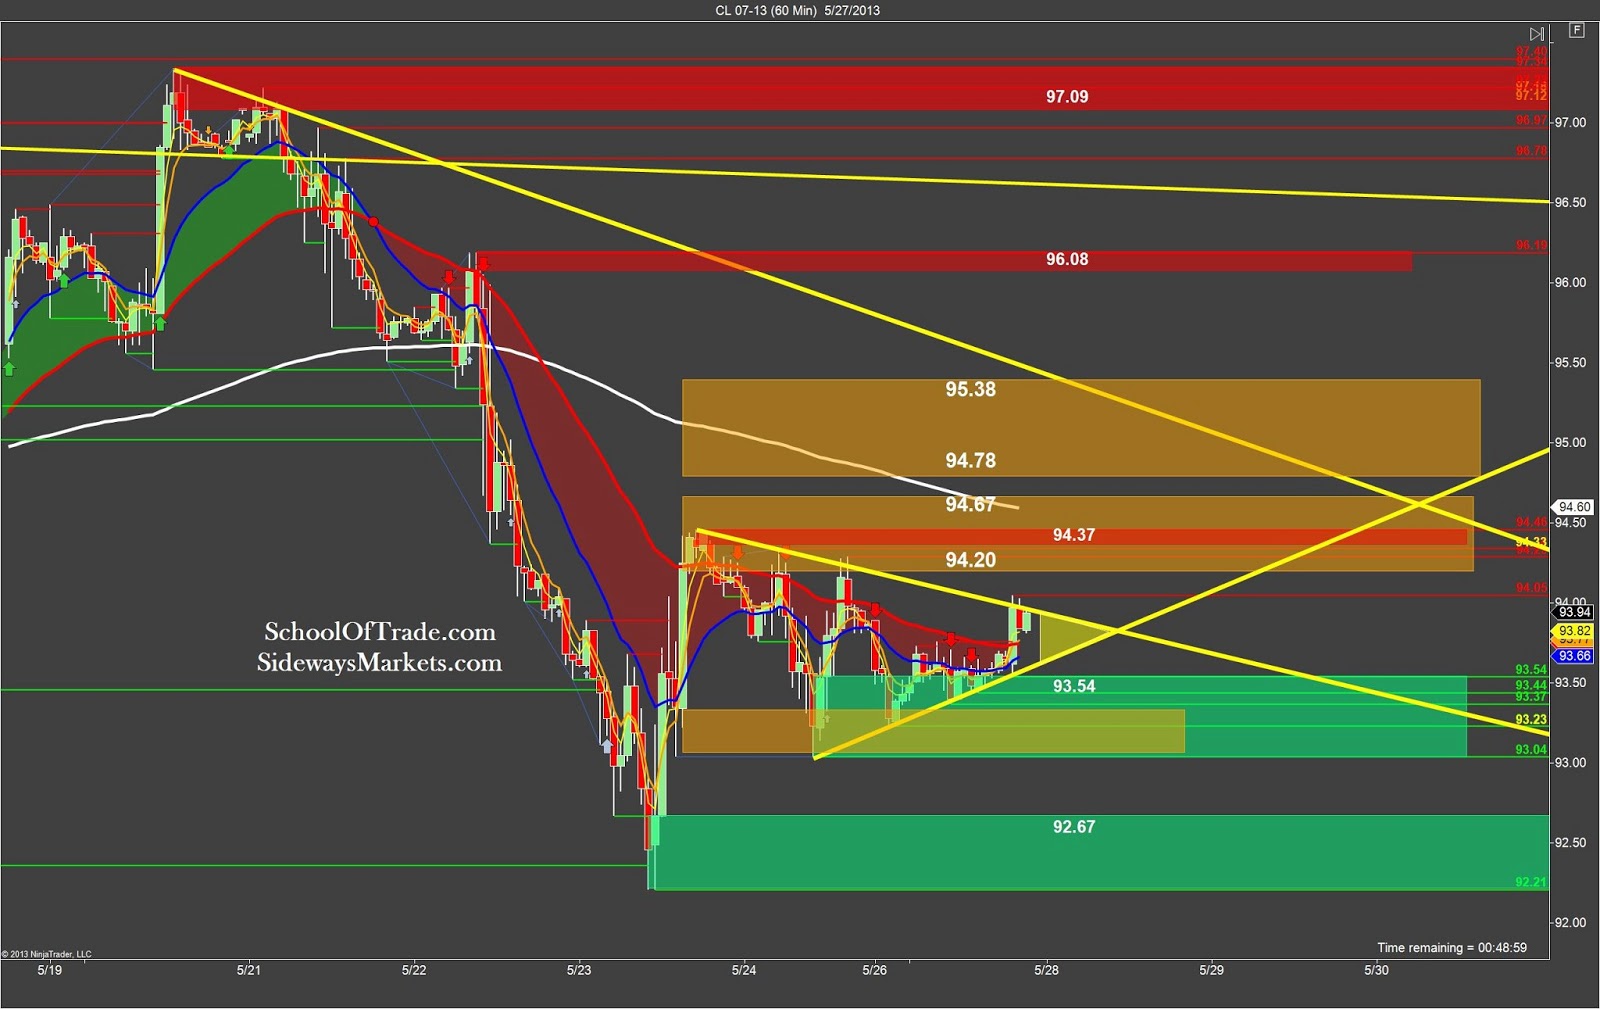
Crude Oil 60-Minute:
The hourly
anchor chart shows us the narrow price-wedge we’re trading inside at this time,
while also telling us that a breakout set-up will be coming soon. Whenever we see the ending of a price-wedge we
know to be ready to react for the high-percentage-trades that may follow. We can see a recent test of the trigger-zone support
around 93.35 and prices began to move higher as we go into Tuesday’s trading
session.
Click here to view ALL of the Daily
price-levels
price-levels
We recall
that the 4-hour chart (above) told us to look for buying opportunities this
evening and tomorrow so we can see that the best way to do that will be to wait
for prices to pull back and allow us to enter the market long ahead of the resistance
starting at 94.20.
We need to get into our
long position soon and not too close to trading into the resistance overhead if
we’re going to make the most of this trading opportunity.
long position soon and not too close to trading into the resistance overhead if
we’re going to make the most of this trading opportunity.
===========================================================
Looking for the best trading
opportunities?
opportunities?
Did you see the Crude Oil Prep?
Want to see me trade LIVE?
Our Live trade-room is open for TRIAL
MEMBERS.
Join the Premier Live trade-room as
an Advanced Member