September 24, 2013
- in Uncategorized by schooloftrade
Crude Oil Day trading strategy; Morning Prep Screen to Floor 09/24/13

7:30am EST
Focus-Points this morning:
· Economic News was mixed coming out of
Europe
Europe
· The uncertainty at the Fed is causing
weakness in the emerging markets
weakness in the emerging markets
· Overall, markets trade cautiously
waiting for more information from the Fed
waiting for more information from the Fed
· Traders prepare for news from Home
Prices and Consumer Confidence today
Prices and Consumer Confidence today
 |
| News Today |
Economic News on the schedule today:
This morning we have two major news events on the schedule,
with 2 additional times for Fed Speakers.
We had a very active session on Monday with 3 Fed Speakers, and today is
likely to be very similar market personality.
Our news is at 9:00am and 10:00am EST so we will wait patiently today
for the best price-action around these news events.
with 2 additional times for Fed Speakers.
We had a very active session on Monday with 3 Fed Speakers, and today is
likely to be very similar market personality.
Our news is at 9:00am and 10:00am EST so we will wait patiently today
for the best price-action around these news events.
9:00am EST S&P
Case Schiller Home Price Index
10:00am EST Consumer
Confidence
Confidence
4:30pm EST API Crude Oil Inventories News
Crude Oil Analysis:
 |
| Crude Oil 5400t |
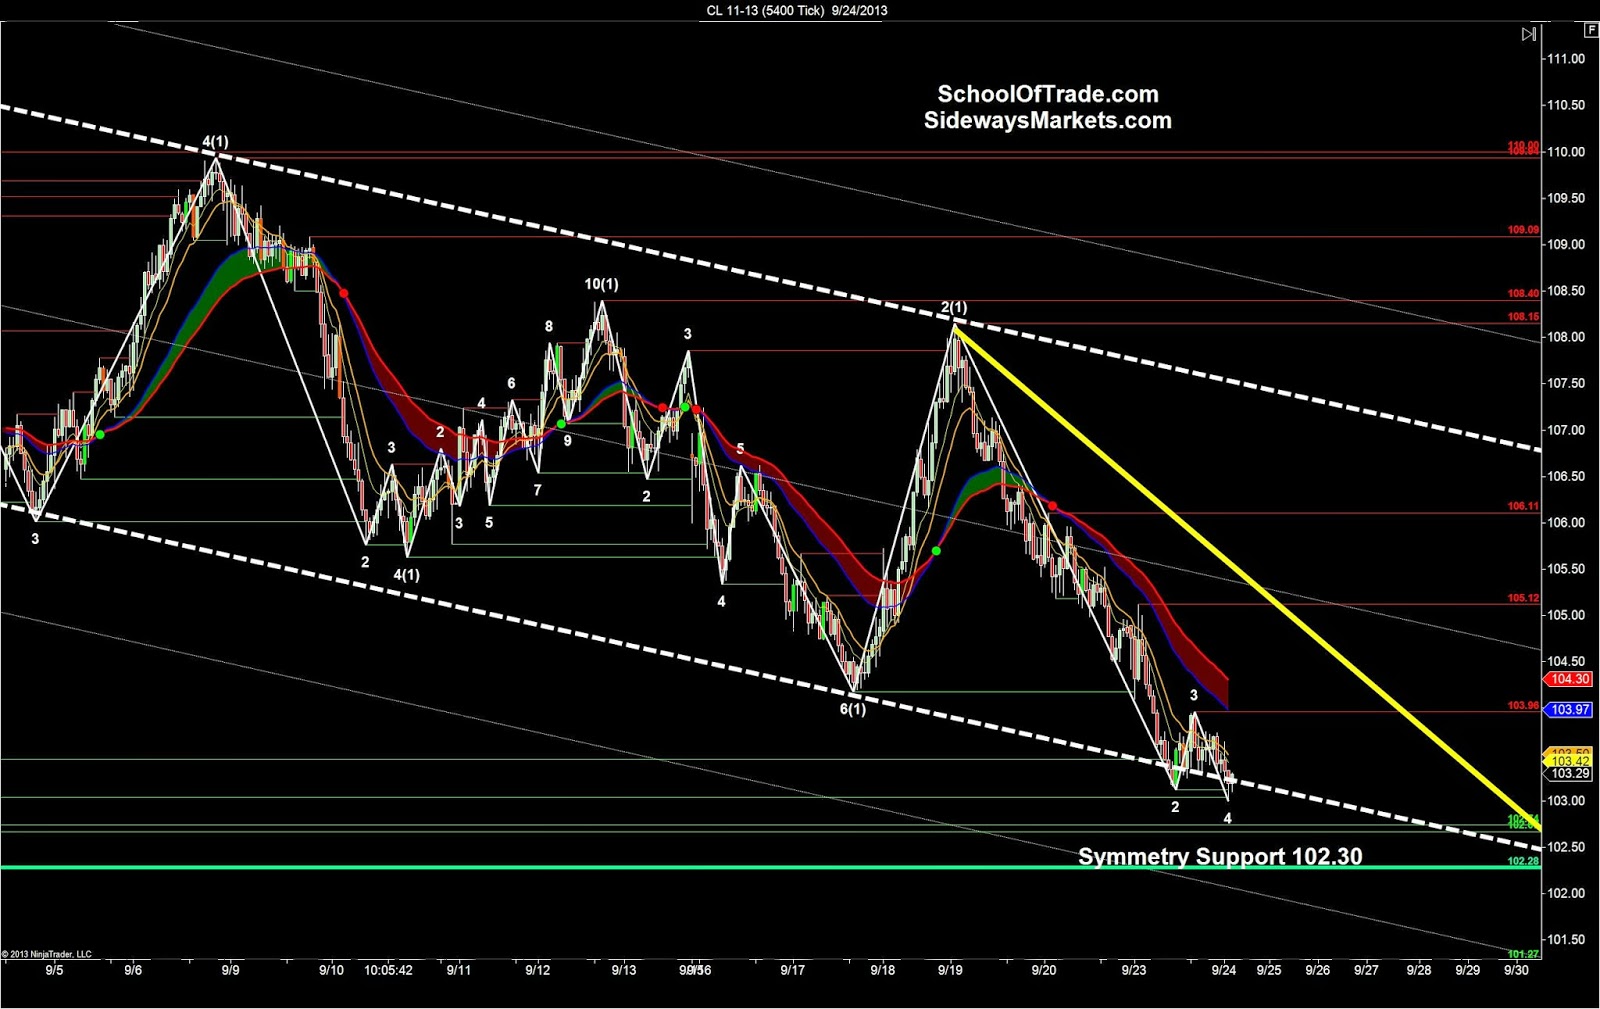
We begin each session with a review of our anchor charts
first, and this morning we can see everything points to lower prices with a
very easy-to-find downward trend.
first, and this morning we can see everything points to lower prices with a
very easy-to-find downward trend.
The 5400-tick chart shows us trading at the lows of the bear price-channel,
with symmetry support at 102.30 which is about $1.00 below us at this time,
which can easily be tested today and will be used for our first profit-target if
we can get into a short position early in the session.
with symmetry support at 102.30 which is about $1.00 below us at this time,
which can easily be tested today and will be used for our first profit-target if
we can get into a short position early in the session.
 |
| Crude Oil 1800t |
The 1800-tick chart shows us a similar long-term trend that
is bearish, which confirms we are indeed looking for selling-opportunities as
the high-percentage-trades this morning.
We notice the low wave-count on this chart, so we are looking for new lower-lows
from initiating sellers below 103.00 or a test of the sell-zone at 104.06 for
easy selling-opportunities this morning.
 |
| Crude Oil 600t |
The 600-tick chart shows us much of the same information; a
bearish trend, a very low wave-count and three (3) sell-zones overhead that we
will use for selling-opportunities this morning. First, if we get new lower-lows we will then
be looking for our entry patterns to get short down to that symmetry support we
found on the anchor chart above. Second,
we will sell short with a test of any of the three sell-zones overhead at 103.32,
103.48, and 103.75.
 |
| Crude Oil 30M |
Our 30-minute VIP Chart shows us many clues this morning,
with price-action trading on top of the PLOD at 103.12, the prior week’s lows
above us at 104.18, and a very narrow trading-range coming out of London. The most important thing we get from this
chart is the PLOD. If we see sellers ‘initiating’
activity below the PLOD we will assume these sellers see value with lower
prices, so we will be looking for selling-opportunities below the 103.12 this
morning. If those sellers cannot keep
prices below the PLOD we will see a test of the 104.18 and possibly the 105.12 PHOD
later in the session. We will be keeping
a close eye on the sellers, because if they fail this morning we know where the
buyers are going to take this price-action shortly afterwards and we want to be
ready. 


with price-action trading on top of the PLOD at 103.12, the prior week’s lows
above us at 104.18, and a very narrow trading-range coming out of London. The most important thing we get from this
chart is the PLOD. If we see sellers ‘initiating’
activity below the PLOD we will assume these sellers see value with lower
prices, so we will be looking for selling-opportunities below the 103.12 this
morning. If those sellers cannot keep
prices below the PLOD we will see a test of the 104.18 and possibly the 105.12 PHOD
later in the session. We will be keeping
a close eye on the sellers, because if they fail this morning we know where the
buyers are going to take this price-action shortly afterwards and we want to be
ready.
PIT SESSION PRICE LEVELS:

