March 26, 2013
- in Uncategorized by schooloftrade
Crude Oil day trading plan

 |
| Crude Oil day trading |
Crude Oil Futures
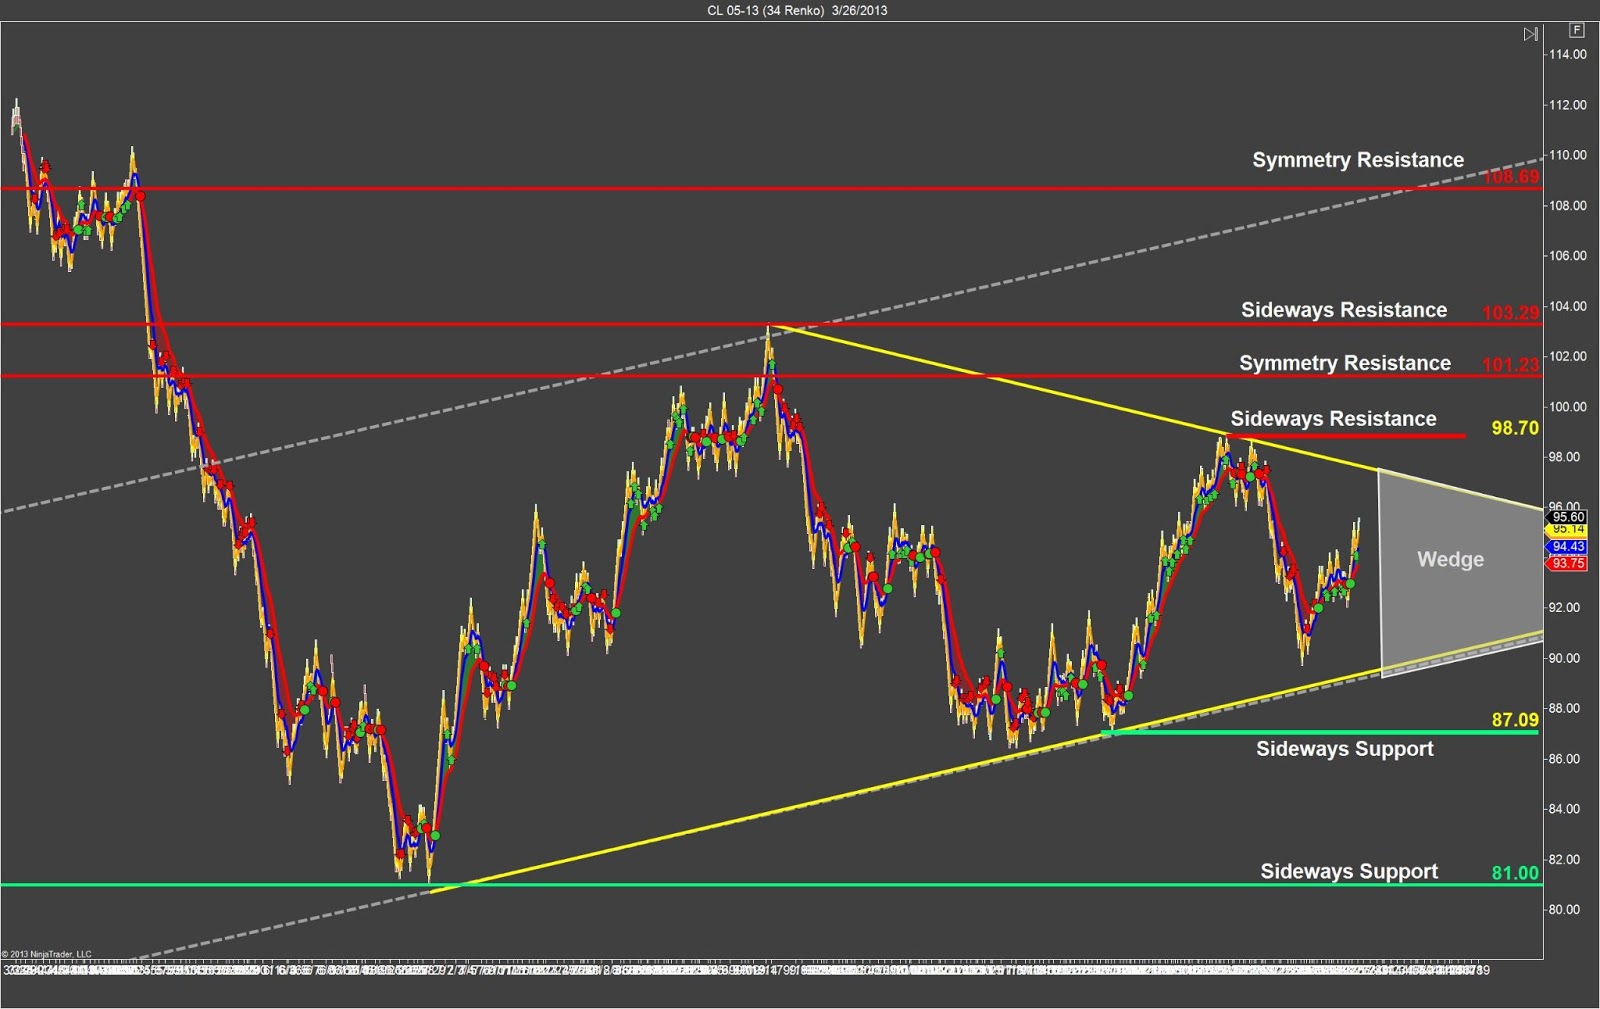
trade in the middle of the price-wedge on the anchor chart #1 and we’re moving
higher towards the highs of this price-wedge.
We will use this directional clue to look for buying opportunities on Crude
Oil.
trade in the middle of the price-wedge on the anchor chart #1 and we’re moving
higher towards the highs of this price-wedge.
We will use this directional clue to look for buying opportunities on Crude
Oil.
The second
anchor chart for Crude Oil shows us a bullish price-channel along with major symmetry
resistance overhead; however, we don’t get many BIG clues other than the resistance
at the highs of the price-channel.
anchor chart for Crude Oil shows us a bullish price-channel along with major symmetry
resistance overhead; however, we don’t get many BIG clues other than the resistance
at the highs of the price-channel.
 |
| Crude Oil day trading 2 |
The entry
chart on Crude Oil shows us the biggest clues this morning with the symmetry resistance,
InsideOut Set-up short, and the possible Wave Entry-Trigger long.
chart on Crude Oil shows us the biggest clues this morning with the symmetry resistance,
InsideOut Set-up short, and the possible Wave Entry-Trigger long.
If we move
higher, we’re buying pullbacks above 95.62 up to the resistance at 97.11 for a
final target. If we move sideways we
must sit-on-hands because we’re trading at the highs of the range and we need
to see what comes next. If price moves
to new lower-lows it will confirm the potential double-top and give us some support
below us as a selling target from that double-top.
 |
| Crude Oil day trading 3 |
If price moves
lower at the PHOD 95.62 this will trigger an InsideOut Set-up short and we will
sell the highs of the day from Monday and take profit-target at the lows of the
price-channel support and the lows of the day from Monday at 93.72. Join us HERE.
lower at the PHOD 95.62 this will trigger an InsideOut Set-up short and we will
sell the highs of the day from Monday and take profit-target at the lows of the
price-channel support and the lows of the day from Monday at 93.72. Join us HERE.